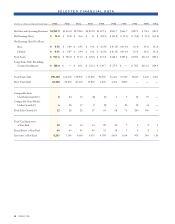
CarMax 2003 Annual Report Download - page 28
Download and view the complete annual report
Please find page 28 of the 2003 CarMax annual report below. You can navigate through the pages in the report by either clicking on the pages listed below, or by using the keyword search tool below to find specific information within the annual report.-
 1
1 -
2
-
3
-
4
-
5
-
6
-
7
-
8
-
9
-
10
-
11
-
12
-
13
-
14
-
15
-
16
-
17
-
 18
18 -
 19
19 -
 20
20 -
 21
21 -
 22
22 -
 23
23 -
 24
24 -
 25
25 -
 26
26 -
 27
27 -
 28
28 -
 29
29 -
 30
30 -
 31
31 -
 32
32 -
 33
33 -
 34
34 -
 35
35 -
 36
36 -
 37
37 -
 38
38 -
39
-
40
-
41
-
42
-
43
-
44
-
45
-
46
-
47
-
48
-
49
-
50
-
51
-
52
 |
 |

26 CARMAX 2003
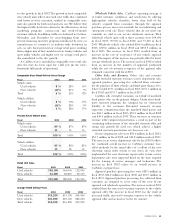
CarMax currently operates 23 of its sales locations
pursuant to various leases under which Circuit City Stores
was the original tenant and primary obligor. Circuit City
Stores and not CarMax had originally entered into these
leases so that CarMax could take advantage of the
favorable economic terms available to Circuit City Stores
as a large retailer. Circuit City Stores has assigned each of
these leases to CarMax. Despite the assignment and
pursuant to the terms of the leases, Circuit City Stores
remains contingently liable under the leases. In
recognition of this ongoing contingent liability, CarMax
made a one-time special dividend payment of $28.4
million to Circuit City Stores on October 1, 2002, the
separation date.
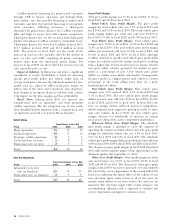
CAPITAL STRUCTURE
During fiscal 2003, stockholders’ equity increased 14% to
$554.6 million from $485.5 million in fiscal 2002.
Capitalization for the past three years is illustrated in the
“Capitalization” table below. The return on equity was
18.2% in fiscal 2003, compared with 20.7% in fiscal 2002.
Excluding separation costs of $7.8 million in fiscal 2003 and
$0.4 million in fiscal 2002, the return on equity in fiscal
2003 was 19.7% and 20.8% in fiscal 2002.
MARKET RISK
Automobile Installment Loan Receivables
At February 28, 2003, and February 28, 2002, all loans in the
portfolio of automobile loan receivables were fixed-rate
installment loans. Financing for these automobile loan
receivables is achieved through asset securitization programs
that, in turn, issue both fixed- and floating-rate securities.
Interest rate exposure relating to floating-rate securitizations
is managed through the use of interest rate swaps.
Receivables held for investment or sale are financed with
working capital. Generally, changes in interest rates
associated with underlying swaps will not have a material
impact on earnings. However, changes in interest rates
associated with underlying swaps may have a material impact
on cash and cash flows.
Credit risk is the exposure to nonperformance of another
party to an agreement. Credit risk is mitigated by dealing
with highly rated bank counterparties. The market and
credit risks associated with financial derivatives are similar to
those relating to other types of financial instruments. Refer
to Note 13 to the company’s consolidated financial
statements for a description of these items.
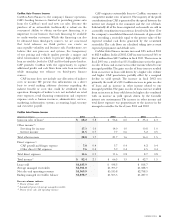
The total principal amount of ending managed
receivables as of February 28, 2003, and February 28, 2002,
was as follows:
(Amounts in millions) 2003 2002
Fixed-rate securitizations $1,385.1 $1,075.4
Floating-rate securitizations
synthetically altered to fixed 473.2 413.3
Floating-rate securitizations 0.8 0.7
Held for investment(1) 16.0 11.8
Held for sale(2) 3.6 2.1
Total $1,878.7 $1,503.3
(1) The majority is held by a bankruptcy-remote, qualified special purpose entity.
(2) Held by a bankruptcy-remote, qualified special purpose entity.
Interest Rate Exposure
The company also has interest rate risk from changing
interest rates related to our outstanding debt. Substantially all
of the debt is floating-rate debt based on LIBOR. A 100-
basis point increase in market interest rates would not have
had a material effect on our fiscal 2003 results of operations
or cash flows.
Capitalization
Fiscal (Dollar amounts in millions) 2003 2002 2001
Long-term debt, excluding current installments $100.0 15% $ — 0% $ 83.1 17%
Other long-term liabilities 14.9 2 11.4 2 10.5 2
Total stockholders’ equity 554.6 83 485.5 98 391.5 81
Total capitalization $669.5 100% $496.8 100% $485.1 100%
CONTRACTUAL OBLIGATIONS
2 to 3 4 to 5 After 5
(Amounts in millions) Total 1 Year Years Years Years
Contractual obligations:
Long-term debt $100.0 $ — $100.0 $ — $ —
Operating leases 745.8 48.2 95.7 92.3 509.6
Lines of credit 56.1 56.1 — — —
Total $901.9 $104.3 $195.7 $92.3 $509.6