CarMax 2003 Annual Report Download - page 25
Download and view the complete annual report
Please find page 25 of the 2003 CarMax annual report below. You can navigate through the pages in the report by either clicking on the pages listed below, or by using the keyword search tool below to find specific information within the annual report.-
 1
1 -
2
-
3
-
4
-
5
-
6
-
7
-
8
-
9
-
10
-
11
-
12
-
13
-
14
-
 15
15 -
 16
16 -
 17
17 -
 18
18 -
 19
19 -
 20
20 -
 21
21 -
 22
22 -
 23
23 -
 24
24 -
 25
25 -
 26
26 -
 27
27 -
 28
28 -
 29
29 -
 30
30 -
 31
31 -
 32
32 -
 33
33 -
 34
34 -
 35
35 -
36
-
37
-
38
-
39
-
40
-
41
-
42
-
43
-
44
-
45
-
46
-
47
-
48
-
49
-
50
-
51
-
52
 |
 |

CARMAX 2003 23
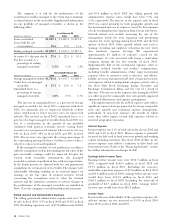
Selected Quarterly Financial Data (Unaudited)
(Amounts in thousands First Quarter Second Quarter Third Quarter Fourth Quarter Fiscal Year
except per share data) 2003 2002 2003 2002 2003 2002 2003 2002 2003 2002
Net sales and
operating revenues $1,005,803 $882,825 $1,080,682 $943,122 $936,819 $852,670 $946,640 $855,142 $3,969,944 $3,533,759
Gross profit $ 122,142 $107,785 $ 128,812 $112,738 $106,940 $ 94,889 $110,345 $103,981 $ 468,239 $ 419,393
CarMax Auto
Finance income $ 19,838 $ 15,685 $ 22,110 $ 18,555 $ 19,220 $ 18,027 $ 21,231 $ 14,206 $ 82,399 $ 66,473
Selling, general and
administrative expenses $ 93,037 $ 78,060 $ 97,997 $ 85,029 $101,810 $ 83,117 $ 99,573 $ 88,258 $ 392,417 $ 334,464
Separation costs $ 1,871 $—$ 1,265 $—$ 4,479 $—$ 153 $ 426 $ 7,768 $ 426
Selling, general and admin-
istrative expenses exclud-
ing separation costs $ 91,166 $ 78,060 $ 96,732 $ 85,029 $ 97,331 $ 83,117 $ 99,420 $ 87,832 $ 384,649 $ 334,038
Net earnings $ 29,238 $ 26,572 $ 31,714 $ 27,391 $ 14,717 $ 18,443 $ 19,133 $ 18,396 $ 94,802 $ 90,802
Net earnings excluding
separation costs $ 31,109 $ 26,572 $ 32,979 $ 27,391 $ 19,196 $ 18,443 $ 19,286 $ 18,822 $ 102,570 $ 91,228
Net earnings per share:
Basic $0.28$0.26$ 0.31 $ 0.27 $ 0.14 $ 0.18 $ 0.19 $ 0.18 $ 0.92 $ 0.89
Diluted $0.28$0.26$ 0.30 $ 0.26 $ 0.14 $ 0.18 $ 0.18 $ 0.18 $ 0.91 $ 0.87
Net earnings per share
excluding separation costs:
Basic $0.30$0.26$ 0.32 $ 0.27 $ 0.19 $ 0.18 $ 0.19 $ 0.18 $ 1.00 $ 0.89
Diluted $0.30$0.26$ 0.32 $ 0.26 $ 0.18 $ 0.18 $ 0.18 $ 0.18 $ 0.98 $ 0.88
Net Earnings
Net earnings were $94.8 million in fiscal 2003,
$90.8 million in fiscal 2002 and $45.6 million in fiscal 2001.
Excluding the non-tax-deductible, separation expenses of
$7.8 million in fiscal 2003 and $0.4 million in fiscal 2002,
earnings would have been $102.6 million in fiscal 2003 and
$91.2 million in fiscal 2002. Excluding the tax-affected
write-down of goodwill of $5.4 million in fiscal 2001, net
earnings would have been $51.0 million.
OPERATIONS OUTLOOK
CarMax continues to demonstrate that its consumer offer and
business model can produce strong sales and earnings growth.
At the beginning of fiscal 2002, CarMax announced that it
would resume geographic growth. This expansion is
proceeding as planned with a total of five stores opened during
fiscal 2003. In addition to one standard-sized superstore
originally planned in fiscal 2003 but opened in March of fiscal
2004, we plan to open approximately four standard-sized used
car superstores and three prototype satellite superstores in fiscal
2004.We may also open an eighth store in the fourth quarter.
In April of fiscal 2004, we sold the Jeep franchise in Kenosha,
Wis. Also in fiscal 2004, we plan to sell our five Mitsubishi new
car franchises.The sale of the Mitsubishi franchises, which are
integrated with used car superstores, will create more space for
used car sales expansion, which is more profitable for us. In
addition, in Los Angeles we intend to integrate our two
remaining stand-alone franchises with a used car superstore
during the second half of fiscal 2004.
Comparable store used unit sales growth is a primary driver
of CarMax’s profitability. We believe that our used unit
comparable sales growth will be in the range of 5% to
9% in fiscal 2004 and net earnings in the range of
$105 million to $116 million. This forecast assumes the
continuation of the reduced approval rates from our non-
prime loan providers experienced in the fourth quarter of
fiscal 2003. The expense leverage that we would normally
expect from the comparable store used unit growth is
estimated to be more than offset by the full year of incremental
costs associated with being a stand-alone company and some
additional costs related to our geographic growth. We estimate
the full-year effect of being a stand-alone company to be
approximately $20 to $22 million, with a majority of the
$11 million to $13 million incremental portion of this increase
during the first seven months of fiscal 2004.