CarMax 2003 Annual Report Download - page 40
Download and view the complete annual report
Please find page 40 of the 2003 CarMax annual report below. You can navigate through the pages in the report by either clicking on the pages listed below, or by using the keyword search tool below to find specific information within the annual report.-
 1
1 -
2
-
3
-
4
-
5
-
6
-
7
-
8
-
9
-
10
-
11
-
12
-
13
-
14
-
15
-
16
-
17
-
18
-
19
-
20
-
21
-
22
-
23
-
24
-
25
-
26
-
27
-
28
-
29
-
 30
30 -
 31
31 -
 32
32 -
 33
33 -
 34
34 -
 35
35 -
 36
36 -
 37
37 -
 38
38 -
 39
39 -
 40
40 -
 41
41 -
 42
42 -
 43
43 -
 44
44 -
 45
45 -
 46
46 -
 47
47 -
 48
48 -
 49
49 -
 50
50 -
51
-
52
 |
 |

At February 28, 2003, a total of 903,509 shares remained
available under the CarMax plan. Shares purchased on the
open market on behalf of employees were 213,931 during
fiscal 2003; 183,902 during fiscal 2002; and 477,094 during
fiscal 2001. The average price per share purchased under the
plans was $19.43 in fiscal 2003, $17.13 in fiscal 2002 and $4.18
in fiscal 2001. The company match totaled $520,700 in fiscal
2003; $384,800 in fiscal 2002; and $247,000 in fiscal 2001.
(E) 401(k) Plan
CarMax sponsors a 401(k) plan for all employees meeting
certain eligibility criteria. Under the plan, eligible employees
can contribute up to 40% of their salaries, and the company
matches a portion of those associate contributions. The total
expense for this plan was $1.0 million in fiscal 2003; $885,000
in fiscal 2002; and $686,000 in fiscal 2001.
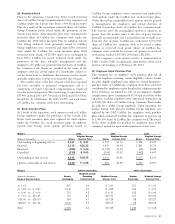
EARNINGS PER SHARE
CarMax was a wholly owned subsidiary of Circuit City Stores
during a portion of the periods presented. Earnings per share
have been presented to reflect the capital structure effective
with the separation of CarMax from Circuit City Stores.
All earnings per share calculations have been computed as
if the separation had occurred at the beginning of the periods
presented.
Reconciliations of the numerator and denominator of
basic and diluted earnings per share are presented below:
(Amounts in thousands Years Ended February 28
except per share data) 2003 2002 2001
Weighted average
common shares 102,983 102,039 100,994
Dilutive potential
common shares:
Options 1,579 1,950 1,332
Restricted stock 833 94
Weighted average common
shares and dilutive
potential common shares 104,570 104,022 102,420
Net earnings available
to common shareholders $94,802 $90,802 $45,564
Basic net earnings per share $ 0.92 $ 0.89 $ 0.45
Diluted net earnings
per share $ 0.91 $ 0.87 $ 0.44
Certain options were outstanding and not included in the
computation of diluted earnings per share because the
options’ exercise prices were greater than the average market
price of the common shares. Options to purchase 1,053,610
shares of CarMax, Inc. common stock with exercise prices
ranging from $18.60 to $43.44 per share were outstanding
and not included in the calculation at the end of fiscal 2003;
15,364 shares with exercise prices ranging from $37.49 to
$43.44 per share at the end of fiscal 2002; and 1,382,935
shares with exercise prices ranging from $6.06 to $43.44 per
share at the end of fiscal 2001.
38 CARMAX 2003
8
7
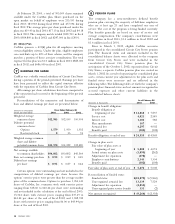
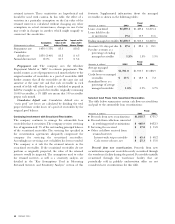
PENSION PLANS
The company has a noncontributory defined benefit
pension plan covering the majority of full-time employees
who are at least age 21 and have completed one year of
service. The cost of the program is being funded currently.
Plan benefits generally are based on years of service and
average compensation. The company’s contributions were
$2.3 million in fiscal 2003, $1.3 million in fiscal 2002 and
$1.6 million in fiscal 2001.
Prior to March 1, 2002, eligible CarMax associates
participated in the consolidated Circuit City Stores pension
plan. The financial status and amounts included in the
consolidated balance sheets were allocated to the company
from Circuit City Stores and were included in the
consolidated Circuit City Stores pension plan. In
anticipation of the October 1, 2002, separation from Circuit
City Stores, a separate CarMax pension plan was created on
March 1, 2002.As a result of separating the consolidated plan
assets, certain current year adjustments to the plan assets and
funded status were necessary and are reflected in the
following tables.The following tables set forth the company’s
pension plan’s financial status and net amounts recognized in
accrued expenses and other current liabilities in the
consolidated balance sheets:
As of February 28
(Amounts in thousands) 2003 2002
Change in benefit obligation:
Benefit obligation at
beginning of year $ 14,868 $ 7,837
Service cost 4,021 2,549
Interest cost 1,104 588
Plan amendments 367 —
Actuarial loss 4,297 4,002
Benefits paid (102) (108)
Benefit obligation at end of year $ 24,555 $14,868
Change in plan assets:
Fair value of plan assets at
beginning of year $ 5,008 $ 4,074
Actual return on plan assets (1,095) (262)
Adjustment for separation (478) —
Employer contributions 2,343 1,304
Benefits paid (102) (108)
Fair value of plan assets at end of year $ 5,676 $ 5,008
Reconciliation of funded status:
Funded status $(18,879) $ (9,860)
Unrecognized actuarial loss 13,339 7,524
Adjustment for separation (4,055) —
Unrecognized prior service benefit 331 (2)
Net amount recognized $ (9,264) $ (2,338)