CarMax 2003 Annual Report Download - page 24
Download and view the complete annual report
Please find page 24 of the 2003 CarMax annual report below. You can navigate through the pages in the report by either clicking on the pages listed below, or by using the keyword search tool below to find specific information within the annual report.-
 1
1 -
2
-
3
-
4
-
5
-
6
-
7
-
8
-
9
-
10
-
11
-
12
-
13
-
 14
14 -
 15
15 -
 16
16 -
 17
17 -
 18
18 -
 19
19 -
 20
20 -
 21
21 -
 22
22 -
 23
23 -
 24
24 -
 25
25 -
 26
26 -
 27
27 -
 28
28 -
 29
29 -
 30
30 -
 31
31 -
 32
32 -
 33
33 -
 34
34 -
35
-
36
-
37
-
38
-
39
-
40
-
41
-
42
-
43
-
44
-
45
-
46
-
47
-
48
-
49
-
50
-
51
-
52
 |
 |

22 CARMAX 2003
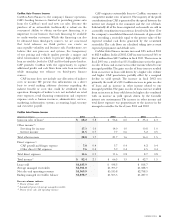
The company is at risk for the performance of the
securitized receivables managed to the extent that it maintains
a retained interest in the receivables. Supplemental information
on our portfolio of managed receivables is shown in the
following tables:
As of February 28
(Amounts in millions) 2003 2002 2001
Loans securitized $1,859.1 $1,489.4 $1,215.4
Loans held for sale
or investment 19.6 13.9 11.6
Ending managed receivables $1,878.7 $1,503.3 $1,227.0
Accounts 31+ days past due $ 27.6 $ 22.3 $ 18.1
Past due accounts as a
percentage of ending
managed receivables 1.5% 1.5% 1.5%
Years Ended February 28
(Amounts in millions) 2003 2002 2001
Average managed receivables $1,701.0 $1,393.7 $1,088.9
Credit losses on managed
receivables $ 17.5 $ 12.9 $ 7.2
Annualized losses as a
percentage of average
managed receivables 1.0% 0.9% 0.7%
The increase in annualized losses as a percent of average
managed receivables for fiscal 2003 compared with fiscal
2002 was primarily due to depressed wholesale vehicle
values which lead to lower recovery rates on repossessed
vehicles. The increase in fiscal 2002 annualized losses as a
percent of average managed receivables from fiscal 2001 was
due to a moderation in the growth of our portfolio
combined with general economic factors causing lower
recovery rates on repossessed vehicles.The recovery rate was
43% in fiscal 2003, 45% in fiscal 2002 and 48% in fiscal
2001.The recovery rate represents the average percentage of
the outstanding principal balance CarMax receives when a
vehicle is repossessed and liquidated.
If the managed receivables do not perform in accordance
with the assumptions used in determining the fair value of the
gain receivable, earnings could be impacted. Despite the
current weak economic environment, the managed
receivables continue to perform in line with our expectations.
In the fourth quarter, we adjusted both loss and prepayment
assumptions for certain pools of receivables.The changes were
substantially offsetting resulting in no material impact on
earnings or the fair value of retained interests. Detail
concerning the assumptions used to value the retained
interests and the valuation’s sensitivity to adverse changes in
the performance of the managed receivables are included in
Note 12 to the company’s consolidated financial statements.
Selling, General and Administrative Expenses
The selling, general and administrative expense ratio was 9.9%
of sales in fiscal 2003, 9.5% in fiscal 2002 and 10.8% in fiscal
2001. Excluding separation costs of $7.8 million in fiscal 2003
and $0.4 million in fiscal 2002, the selling, general and
administrative expense ratios would have been 9.7% and
9.5%, respectively. The increase in the expense ratio in fiscal
2003 was caused primarily by both geographic growth and
the incremental increase in expenses caused by diseconomies
of scale resulting from the separation from Circuit City Stores.
Growth related costs include increasing the size of the
management bench for store expansion and preopening
expenses for stores opening during fiscal 2004 and the first
quarter of fiscal 2005. Other growth related costs such as
training, recruiting and employee relocation for new stores
also moderate expense leverage. We experienced
approximately $9 million of expenses caused by the
diseconomies of scale associated with being a stand-alone
company during the last five months of fiscal 2003.
Approximately half of the incremental expenses relate to
employee medical benefits and workers’ compensation,
including benefits administration. Other larger incremental
expenses relate to insurance, such as directors’ and officers’
liability; necessary incremental staff, such as legal and treasury;
and expenses related to independent company activity, such as
the New York Stock Exchange listing, Securities and
Exchange Commission filings and the cost of a board of
directors. The increase in the expense ratio during fiscal 2003
was offset in part by comparable store sales growth, improved
operational effectiveness and expense management.
The improvement in the fiscal 2002 expense ratio reflects
significant expense leverage generated by strong comparable
store sales growth and continued expense management,
particularly of non-store expenses, the benefit of which
more than offset higher second half expenses related to
renewed geographic expansion.
Interest Expense
Interest expense was 0.1% of total sales in fiscal years 2003 and
2002 and 0.4% in fiscal 2001. Interest expense is primarily
incurred on debt used to fund new store growth and working
capital, including inventory. The fiscal 2002 decline in the
interest expense ratio reflects a reduction in debt levels and
lower interest rates. Refer to the “Financing Activities” section
for further information on changes in debt.
Earnings before Income Taxes
Earnings before income taxes were $156.7 million in fiscal
2003, compared with $146.5 million in fiscal 2002 and
$73.5 million in fiscal 2001. Excluding the non-tax-
deductible, separation expenses of $7.8 million in fiscal 2003
and $0.4 million in fiscal 2002, earnings before income taxes
would have been $164.5 million in fiscal 2003 and
$146.9 million in fiscal 2002. Excluding the write-off of
goodwill of $8.7 million in fiscal 2001, earnings before
income taxes would have been $82.2 million.
Income Taxes
Based on the non-deductibility of the separation expenses, the
effective income tax rate increased to 39.5% in fiscal 2003
from 38.0% in fiscal 2002 and 2001.