CarMax 2003 Annual Report Download - page 23
Download and view the complete annual report
Please find page 23 of the 2003 CarMax annual report below. You can navigate through the pages in the report by either clicking on the pages listed below, or by using the keyword search tool below to find specific information within the annual report.-
 1
1 -
2
-
3
-
4
-
5
-
6
-
7
-
8
-
9
-
10
-
11
-
12
-
 13
13 -
 14
14 -
 15
15 -
 16
16 -
 17
17 -
 18
18 -
 19
19 -
 20
20 -
 21
21 -
 22
22 -
 23
23 -
 24
24 -
 25
25 -
 26
26 -
 27
27 -
 28
28 -
 29
29 -
 30
30 -
 31
31 -
 32
32 -
 33
33 -
34
-
35
-
36
-
37
-
38
-
39
-
40
-
41
-
42
-
43
-
44
-
45
-
46
-
47
-
48
-
49
-
50
-
51
-
52
 |
 |

CARMAX 2003 21
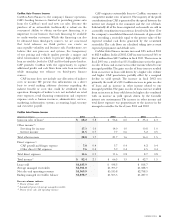
CarMax Auto Finance Income
(Amounts in millions) 2003 % 2002 % 2001 %
Gains on sales of loans(1) $ 68.2 5.8 $ 56.4 6.0 $ 35.4 4.3
Other income(2):
Servicing fee income 17.3 1.0 14.0 1.0 10.8 1.0
Interest income 11.5 0.7 7.7 0.6 5.2 0.5
Total other income 28.8 1.7 21.7 1.6 16.0 1.5
Direct expenses(2):
CAF payroll and fringes expense 7.0 0.4 5.7 0.4 4.2 0.4
Other direct CAF expenses 7.6 0.4 5.9 0.4 4.5 0.4
Total direct expenses 14.6 0.9 11.6 0.8 8.7 0.8
Total income(3) $ 82.4 2.1 $ 66.5 1.9 $ 42.7 1.5
Loans sold $1,185.9 $ 938.5 $ 818.7
Average managed receivables $1,701.0 $1,393.7 $1,088.9
Net sales and operating revenues $3,969.9 $3,533.8 $2,758.5
Ending managed receivables balance $1,878.7 $1,503.3 $1,227.0
Percent columns indicate:
(1) Percent of loans sold
(2) Annualized percent of average managed receivables
(3) Percent of net sales and operating revenues
CarMax Auto Finance Income
CarMax Auto Finance is the company’s finance operation.
CAF’s lending business is limited to providing prime auto
loans for CarMax’s used and new car sales. Because the
purchase of an automobile traditionally is reliant on the
consumer’s ability to obtain on-the-spot financing, it is
important to our business that such financing be available
to credit-worthy customers. While this financing can also
be obtained from third-party sources, we are concerned
that total reliance on third parties can create an
unacceptable volatility and business risk. Furthermore, we
believe that our processes and systems, the transparency
of our pricing and vehicle quality provide a unique and
ideal environment in which to procure high-quality auto
loan receivables, both for CAF and for third-party lenders.
CAF provides CarMax with the opportunity to capture
additional profits and cash flows from auto loan receivables
while managing our reliance on third-party finance
sources.
CAF income does not include any allocation of indirect
costs or income. We present this information on a direct
basis to avoid making arbitrary decisions regarding the
indirect benefit or costs that could be attributed to this
operation. Examples of indirect costs not included are retail
store expenses, retail financing commissions and corporate
expenses such as human resources, administrative services,
marketing, information systems, accounting, legal, treasury
and executive payroll.
CAF originates automobile loans to CarMax consumers at
competitive market rates of interest.The majority of the profit
contribution from CAF is generated by the spread between the
interest rate charged to the consumer and the cost of funds.
Substantially all of the loans originated each month are sold in
a monthly securitization transaction as described in Note 12 to
the company’s consolidated financial statements. A gain results
from recording a receivable equal to the present value of the
expected residual cash flows generated by the securitized
receivables. The cash flows are calculated taking into account
expected prepayment and default rates.
CarMax Auto Finance income increased 24% in fiscal 2003
to $82.4 million. In fiscal 2002, CAF income increased 56% to
$66.5 million from $42.7 million in fiscal 2001.The increase in
fiscal 2003 was a result of an $11.8 million increase in the gains
on sales of loans and an increase in other income related to our
managed portfolio.The gains on sales of loans increase resulted
from an increase in loans sold driven by a higher sales volume
and higher CAF penetration, partially offset by a marginal
decline in yield spreads. The increase in fiscal 2002 was
primarily the result of a $21.0 million increase in gains on sales
of loans and an increase in other income related to our
managed portfolio.The gains on sales of loans increase resulted
from an increase in loans sold driven by higher sales combined
with an increase in yield spreads driven by the favorable
interest rate environment. The increase in other income and
total direct expenses was proportionate to the increase in the
managed receivables for fiscal years 2003 and 2002.