CVS 2008 Annual Report Download - page 69
Download and view the complete annual report
Please find page 69 of the 2008 CVS annual report below. You can navigate through the pages in the report by either clicking on the pages listed below, or by using the keyword search tool below to find specific information within the annual report.-
 1
1 -
2
-
3
-
4
-
5
-
6
-
7
-
8
-
9
-
10
-
11
-
12
-
13
-
14
-
15
-
16
-
17
-
18
-
19
-
20
-
21
-
22
-
23
-
24
-
25
-
26
-
27
-
28
-
29
-
30
-
31
-
32
-
33
-
34
-
35
-
36
-
37
-
38
-
39
-
40
-
41
-
42
-
43
-
44
-
45
-
46
-
47
-
48
-
49
-
50
-
51
-
52
-
53
-
54
-
55
-
56
-
57
-
58
-
 59
59 -
 60
60 -
 61
61 -
 62
62 -
 63
63 -
 64
64 -
 65
65 -
 66
66 -
 67
67 -
 68
68 -
 69
69 -
 70
70 -
 71
71 -
 72
72 -
 73
73 -
 74
74
 |
 |

2008 ANNUAL REPORT 65
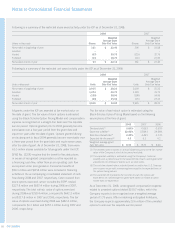
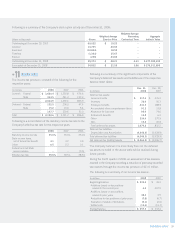
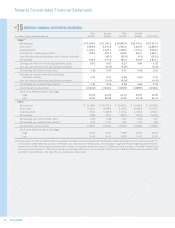
Five-Year Financial Summary
In millions, except per share amounts 2008(1) 2007(2) 2006 2005 2004
Statement of operations data:
Net revenues $ 87,471.9 $ 76,329.5 $ 43,821.4 $ 37,006.7 $ 30,594.6
Gross profi t
18,290.4 16,107.7 11,742.2 9,694.6 7,915.9
Operating expenses(3)(4) 12,244.2 11,314.4 9,300.6 7,675.1 6,461.2
Operating profi t(5) 6,046.2 4,793.3 2,441.6 2,019.5 1,454.7
Interest expense, net 509.5 434.6 215.8 110.5 58.3
Income tax provision(6) 2,192.6 1,721.7 856.9 684.3 477.6
Earnings from continuing operations 3,344.1 2,637.0 1,368.9 1,224.7 918.8
Loss from discontinued operations, net of tax benefi t.(7) (132.0) – – – –
Net earnings $ 3,212.1 $ 2,637.0 $ 1,368.9 $ 1,224.7 $ 918.8
Per common share data:
Basic earnings per common share:
Earnings from continuing operations $ 2.32 $ 1.97 $ 1.65 $ 1.49 $ 1.13
Loss from discontinued operations (0.09) – – – –
Net earnings $ 2.23 $ 1.97 $ 1.65 $ 1.49 $ 1.13
Diluted earnings per common share:
Earnings from continuing operations $ 2.27 $ 1.92 $ 1.60 $ 1.45 $ 1.10
Loss from discontinued operations (0.09) – – – –
Net earnings $ 2.18 $ 1.92 $ 1.60 $ 1.45 $ 1.10
Cash dividends per common share 0.25800 0.22875 0.15500 0.14500 0.13250
Balance sheet and other data:
Total assets $ 60,959.9 $ 54,721.9 $ 20,574.1 $ 15,246.6 $ 14,513.3
Long-term debt (less current portion) $ 8,057.2 $ 8,349.7 $ 2,870.4 $ 1,594.1 $ 1,925.9
Total shareholders’ equity $ 34,574.4 $ 31,321.9 $ 9,917.6 $ 8,331.2 $ 6,987.2
Number of stores (at end of period) 6,923 6,301 6,205 5,474 5,378
(1) On December 23, 2008, our Board of Directors approved a change in our fi scal year-end from the Saturday nearest December 31 of each year to December 31
of each year to better refl ect our position in the health care, rather than the retail industry. The fi scal year change was effective beginning with the fourth quarter
of fi scal 2008. Prior to Board approval of this change, the Saturday nearest December 31, 2008 would have resulted in a 53-week fi scal year that would have
ended January 3, 2009. As you review our operating performance, please consider that fi scal 2008 includes 368 days, compared to each of the remaining
fi scal years presented, which include 364 days.
(2) Effective March 22, 2007, pursuant to the Agreement and Plan of Merger dated as of November 1, 2006, as amended (the “Merger Agreement”),
Caremark Rx, Inc. was merged with and into a newly formed subsidiary of CVS Corporation, with the CVS subsidiary, Caremark Rx, L.L.C. (“Caremark”),
continuing as the surviving entity (the “Caremark Merger”). Following the Caremark Merger, the name of the Company was changed to “CVS Caremark
Corporation.” By virtue of the Caremark Merger, each issued and outstanding share of Caremark common stock, par value $0.001 per share, was con-
verted into the right to receive 1.67 shares of CVS Caremark’s common stock, par value $0.01 per share. Cash was paid in lieu of fractional shares.
(3) In 2006, the Company adopted the Securities and Exchange Commission (SEC) Staff Accounting Bulletin (“SAB”) No. 108, “Considering the Effects of
Prior Year Misstatements when Qualifying Misstatements in Current Year Financial Statements.” The adoption of this statement resulted in a $40.2 million
pre-tax ($24.7 million after-tax) decrease in operating expenses for 2006.
(4) In 2004, the Company conformed its accounting for operating leases and leasehold improvements to the views expressed by the Offi ce of the Chief
Accountant of the Securities and Exchange Commission to the American Institute of Certifi ed Public Accountants on February 7, 2005. As a result, the
Company recorded a non-cash pre-tax adjustment of $65.9 million ($40.5 million after-tax) to operating expenses, which represents the cumulative effect
of the adjustment for a period of approximately 20 years. Since the effect of this non-cash adjustment was not material to 2004, or any previously reported
fi scal year, the cumulative effect was recorded in the fourth quarter of 2004.
(5) Operating profi t includes the pre-tax effect of the charge discussed in Note (3) and Note (4) above.
(6) Income tax provision includes the effect of the following: (i) in 2006, a $11.0 million reversal of previously recorded tax reserves through the tax provision
principally based on resolving certain state tax matters, (ii) in 2005, a $52.6 million reversal of previously recorded tax reserves through the tax provision
principally based on resolving certain state tax matters, and (iii) in 2004, a $60.0 million reversal of previously recorded tax reserves through the tax provi-
sion principally based on fi nalizing certain tax return years and on a 2004 court decision relevant to the industry.
(7) In connection with certain business dispositions completed between 1991 and 1997, the Company continues to guarantee store lease obligations for a
number of former subsidiaries, including Linens ‘n Things. On May 2, 2008, Linens Holding Co. and certain affi liates, which operate Linens ‘n Things, fi led
voluntary petitions under Chapter 11 of the United States Bankruptcy Code in the United States Bankruptcy Court for the District of Delaware. Pursuant to
the court order entered on October 16, 2008, Linens Holding Co. is in the process of liquidating the entire Linens ‘n Things retail chain. The loss from dis-
continued operations includes $132.0 million of lease-related costs ($214.4 million, net of an $82.4 million income tax benefi t), which the Company believes
it will likely be required to satisfy pursuant to its Linens ‘n Things lease guarantees. These amounts, which are expected to change as each lease is resolved,
were calculated in accordance with SFAS No. 146, “Accounting for Costs Associated with Exit or Disposal Activities.”