CVS 2008 Annual Report Download - page 33
Download and view the complete annual report
Please find page 33 of the 2008 CVS annual report below. You can navigate through the pages in the report by either clicking on the pages listed below, or by using the keyword search tool below to find specific information within the annual report.-
 1
1 -
2
-
3
-
4
-
5
-
6
-
7
-
8
-
9
-
10
-
11
-
12
-
13
-
14
-
15
-
16
-
17
-
18
-
19
-
20
-
21
-
22
-
 23
23 -
 24
24 -
 25
25 -
 26
26 -
 27
27 -
 28
28 -
 29
29 -
 30
30 -
 31
31 -
 32
32 -
 33
33 -
 34
34 -
 35
35 -
 36
36 -
 37
37 -
 38
38 -
 39
39 -
 40
40 -
 41
41 -
 42
42 -
 43
43 -
44
-
45
-
46
-
47
-
48
-
49
-
50
-
51
-
52
-
53
-
54
-
55
-
56
-
57
-
58
-
59
-
60
-
61
-
62
-
63
-
64
-
65
-
66
-
67
-
68
-
69
-
70
-
71
-
72
-
73
-
74
 |
 |

2008 ANNUAL REPORT 29
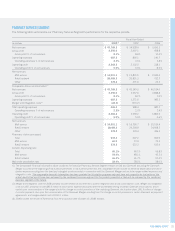
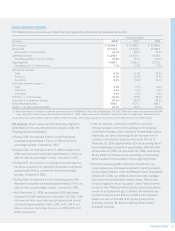
• Our pharmacy gross profi t rates have been adversely affected
by the efforts of managed care organizations, pharmacy
benefi t managers and governmental and other third party
payors to reduce their prescription drug costs. In the event
this trend continues, we may not be able to sustain our
current rate of revenue growth and gross profi t dollars could
be adversely impacted.
Total operating expenses, which include store and administrative
payroll, employee benefi ts, store and administrative occupancy
costs, selling expenses, advertising expenses, administrative
expenses and depreciation and amortization expense decreased
to 23.0% of net revenues in 2008, compared to 23.1% and
22.7% of net revenues in 2007 and 2006, respectively.
As you review our Retail Pharmacy Segment’s performance in
this area, we believe you should consider the following impor-
tant information:
• During 2008, total operating expenses as a percentage
of net revenues continued to be impacted by an increase in
generic drug revenues. Generic drugs typically have a lower
selling price than their brand named equivalents.
• Total operating expenses as a percentage of net revenues
increased during 2007 and 2006, due to increased store payroll
costs, primarily driven by the stores acquired in the Albertson’s
Acquisition, which operate at higher costs due to the geo-
graphic locations of the stores.
• Total operating expenses for 2006 were reduced by $40.2 mil-
lion due to the adoption of SAB 108.
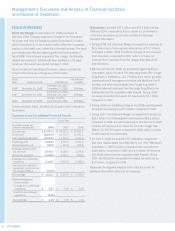
LIQUIDITY AND CAPITAL RESOURCES
Net cash provided by operating activities increased to
$3.9 billion in 2008. This compares to $3.2 billion in 2007
and $1.7 billion in 2006. 2008 includes a full year of net cash
provided by operating activities from Caremark, compared to
2007, which includes Caremark from the merger date (March 22,
2007) forward. 2008 also includes net cash provided by operat-
ing activities from the Longs Drug Stores and RxAmerica from the
acquisition date (October 20, 2008) forward. The increase in net
cash provided by operations during 2007 was primarily due to an
increase in cash receipts from revenues due to the Caremark
Merger and improved operating performance. The increase in net
cash provided by operating activities during 2006 was primarily
due to an increase in cash receipts from revenues received from
the stores acquired in the Albertson’s Acquisition and improved
operating performance.
Net cash used in investing activities increased to $4.6 billion
in 2008. This compares to $3.1 billion in 2007 and $4.6 billion in
2006. The increase in net cash used in investing activities during
2008 was primarily due to the Longs Acquisition. The $3.1 billion
of net cash used in investing activities during 2007 was primarily
due to the Caremark Merger. The increase in net cash used in
investing activities during 2006 was primarily due to the
Albertson’s Acquisition.
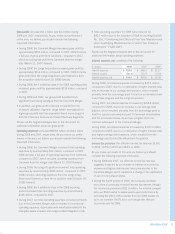
Gross capital expenditures totaled $2.2 billion during 2008,
compared to $1.8 billion in 2007 and 2006. During 2008,
approximately 58.3% of our total capital expenditures were
for new store construction, 16.4% were for store expansion
and improvements and 25.3% were for technology and other
corporate initiatives. During 2009, we plan to invest over
$2.8 billion in gross capital expenditures, which will include
spending for approximately 250-300 new or relocated stores.
Under the Company’s fee-based preferred developer program,
the Company directly funds approximately 65% of its new and
relocation store projects and typically monetizes those projects in
the institutional sale-leaseback market. Proceeds from sale-lease-
back transactions totaled $203.8 million in 2008. This compares
to $601.3 million in 2007 and $1.4 billion in 2006, which
included approximately $800 million in proceeds associated with
a sale-leaseback transaction that included certain properties
acquired in the Albertson’s Acquisition. Under the sale-leaseback
transactions, the properties are sold at fair value, which approxi-
mates net book value, and the resulting leases qualify and are
accounted for as operating leases. During 2008, we delayed our
scheduled fourth quarter sale-leaseback transaction because of
unfavorable market conditions. The specifi c timing and amount of
future sale-leaseback transactions will vary depending on future
market conditions and other factors.
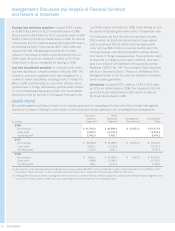
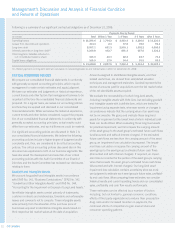
Following is a summary of our store development activity for the
respective years:
2008 2007 2006
Total stores (beginning of year) 6,301 6,205 5,474
New and acquired stores 719 140 848
Closed stores (39) (44) (117)
Total stores (end of year) 6,981 6,301 6,205
Relocated stores(1) 129 137 118
(1) Relocated stores are not included in new or closed store totals.