CVS 2008 Annual Report Download - page 25
Download and view the complete annual report
Please find page 25 of the 2008 CVS annual report below. You can navigate through the pages in the report by either clicking on the pages listed below, or by using the keyword search tool below to find specific information within the annual report.-
 1
1 -
2
-
3
-
4
-
5
-
6
-
7
-
8
-
9
-
10
-
11
-
12
-
13
-
14
-
 15
15 -
 16
16 -
 17
17 -
 18
18 -
 19
19 -
 20
20 -
 21
21 -
 22
22 -
 23
23 -
 24
24 -
 25
25 -
 26
26 -
 27
27 -
 28
28 -
 29
29 -
 30
30 -
 31
31 -
 32
32 -
 33
33 -
 34
34 -
 35
35 -
36
-
37
-
38
-
39
-
40
-
41
-
42
-
43
-
44
-
45
-
46
-
47
-
48
-
49
-
50
-
51
-
52
-
53
-
54
-
55
-
56
-
57
-
58
-
59
-
60
-
61
-
62
-
63
-
64
-
65
-
66
-
67
-
68
-
69
-
70
-
71
-
72
-
73
-
74
 |
 |

2008 ANNUAL REPORT 21
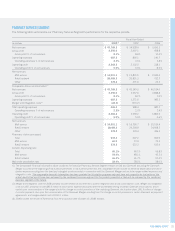
Gross profi t increased $2.2 billion and $4.4 billion during
2008 and 2007, respectively. As you review our performance
in this area, we believe you should consider the following
important information:
• During 2008, the Caremark Merger increased gross profi t by
approximately $553 million, compared to 2007. 2008 includes
a full year of gross profi t from Caremark, compared to 2007,
which includes gross profi t from Caremark from the merger
date (March 22, 2007) forward.
• During 2008, the Longs Acquisition increased gross profi t by
approximately $314 million, compared to 2007. 2008 includes
gross profi t from the Longs Drug Stores and RxAmerica from
the acquisition date (October 20, 2008) forward.
• During 2008, the 4 additional days in the 2008 reporting period
increased gross profi t by approximately $238 million, compared
to 2007.
• During 2008 and 2007, our gross profi t benefi ted from
signifi cant purchasing synergies from the Caremark Merger.
• In addition, our gross profi t continued to benefi t from the
increased utilization of generic drugs (which normally yield a
higher gross profi t rate than equivalent brand name drugs) in
both the Pharmacy Services and Retail Pharmacy Segments.
Please see the Segment Analysis later in this document for
additional information about our gross profi t.
Operating expenses increased $929.8 million and $2.0 billion
during 2008 and 2007, respectively. As you review our perfor-
mance in this area, we believe you should consider the following
important information:
• During 2008, the Caremark Merger increased total operating
expenses by approximately $92 million, compared to 2007.
2008 includes a full year of operating expenses from Caremark,
compared to 2007, which includes operating expenses from
Caremark from the merger date (March 22, 2007) forward.
• During 2008, the Longs Acquisition increased total operating
expenses by approximately $260 million, compared to 2007.
2008 includes operating expenses from the Longs Drug
Stores and RxAmerica from the acquisition date (October 20,
2008) forward.
• During 2008, the 4 additional days in the 2008 reporting
period increased total operating expenses by approximately
$146 million, compared to 2007.
• During 2007, our total operating expenses increased primarily
due to the Caremark Merger, which resulted in incremental
operating expenses, depreciation and amortization related to the
intangible assets acquired and merger-related integration costs.
• Total operating expenses for 2006 were reduced by
$40.2 million due to the adoption of Staff Accounting Bulletin
No. 108, “Considering the Effects of Prior Year Misstatements
when Quantifying Misstatements in Current Year Financial
Statements” (“SAB 108”).
Please see the Segment Analysis later in this document for
additional information about operating expenses.
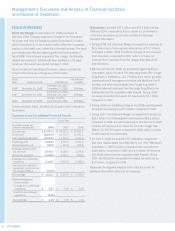
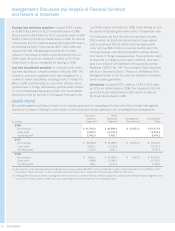
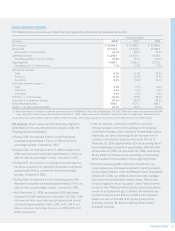
Interest expense, net consisted of the following:
In millions 2008 2007 2006
Interest expense $ 529.8 $ 468.3 $ 231.7
Interest income (20.3) (33.7) (15.9)
Interest expense, net $ 509.5 $ 434.6 $ 215.8
During 2008, net interest expense increased by $74.9 million,
compared to 2007, due to a combination of higher interest rates
and an increase in our average debt balance, which resulted
primarily from the borrowings used to fund an accelerated share
repurchase program and the Longs Acquisition.
During 2007, net interest expense increased by $218.8 million,
compared to 2006, due to an increase in our average debt
balance, which resulted primarily from the borrowings used to
fund the special cash dividend paid to Caremark shareholders
and the accelerated share repurchase program that com-
menced subsequent to the Caremark Merger.
During 2006, net interest expense increased by $105.3 million,
compared to 2005, due to a combination of higher interest rates
and higher average debt balances, which resulted from the
borrowings used to fund the Albertson’s Acquisition.
Income tax provision. Our effective income tax rate was 39.6%
in 2008, 39.5% in 2007 and 38.5% in 2006.
As you review our results in this area, we believe you should
consider the following important information:
• During 2008 and 2007, our effective income tax rate was
negatively impacted by an increase in interest on income tax
reserves and higher state income taxes primarily due to the
Caremark Merger, which resulted in a change in the distribution
of our income between states.
• During the fourth quarter of 2006, the Company recorded
reductions of previously recorded income tax reserves through
the income tax provision of $11.0 million. For internal compari-
sons, we fi nd it useful to assess year-to-year performance by
excluding the effect of this reversal from our 2006 results. As
such, we consider 39.0% to be our comparable effective
income tax rate for 2006.