CVS 2008 Annual Report Download - page 26
Download and view the complete annual report
Please find page 26 of the 2008 CVS annual report below. You can navigate through the pages in the report by either clicking on the pages listed below, or by using the keyword search tool below to find specific information within the annual report.-
 1
1 -
2
-
3
-
4
-
5
-
6
-
7
-
8
-
9
-
10
-
11
-
12
-
13
-
14
-
15
-
 16
16 -
 17
17 -
 18
18 -
 19
19 -
 20
20 -
 21
21 -
 22
22 -
 23
23 -
 24
24 -
 25
25 -
 26
26 -
 27
27 -
 28
28 -
 29
29 -
 30
30 -
 31
31 -
 32
32 -
 33
33 -
 34
34 -
 35
35 -
 36
36 -
37
-
38
-
39
-
40
-
41
-
42
-
43
-
44
-
45
-
46
-
47
-
48
-
49
-
50
-
51
-
52
-
53
-
54
-
55
-
56
-
57
-
58
-
59
-
60
-
61
-
62
-
63
-
64
-
65
-
66
-
67
-
68
-
69
-
70
-
71
-
72
-
73
-
74
 |
 |

22 CVS CAREMARK
Management’s Discussion and Analysis of Financial Condition
and Results of Operations
Earnings from continuing operations increased $707.1 million
or 26.8% to $3.3 billion (or $2.27 per diluted share) in 2008.
This compares to $2.6 billion (or $1.92 per diluted share) in 2007
and $1.4 billion (or $1.60 per diluted share) in 2006. For internal
comparisons, we fi nd it useful to assess year-to-year performance
by excluding the $40.2 million pre-tax ($24.7 million after-tax)
impact of the SAB 108 adjustments and the $11.0 million
reduction of previously recorded income tax reserves from our
2006 results. As such, we consider $1.3 billion (or $1.56 per
diluted share) to be our comparable net earnings in 2006.
Loss from discontinued operations. In connection with certain
business dispositions completed between 1991 and 1997, the
Company continues to guarantee store lease obligations for a
number of former subsidiaries, including Linens ‘n Things. On
May 2, 2008, Linens Holding Co. and certain affi liates, which
operate Linens ‘n Things, fi led voluntary petitions under Chapter
11 of the United States Bankruptcy Code in the United States
Bankruptcy Court for the District of Delaware. Pursuant to the
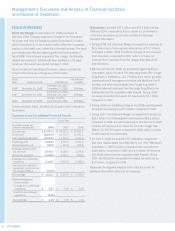
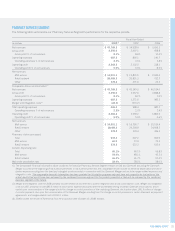
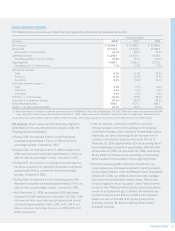
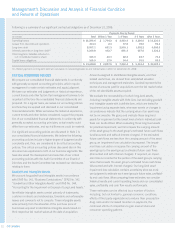
SEGMENT ANALYSIS
We evaluate segment performance based on net revenues, gross profi t and operating profi t before the effect of certain intersegment
activities and charges. Following is a reconciliation of the Company’s business segments to the consolidated fi nancial statements:
Pharmacy Retail
Services Pharmacy Intersegment Consolidated
In millions Segment(1) Segment Eliminations(2) Totals
2008:
Net revenues $ 43,769.2 $ 48,989.9 $ (5,287.2) $ 87,471.9
Gross profi t 3,550.0 14,740.4 18,290.4
Operating profi t 2,562.5 3,483.7 6,046.2
2007:
Net revenues $ 34,938.4 $ 45,086.5 $ (3,695.4) $ 76,329.5
Gross profi t 2,997.1 13,110.6 16,107.7
Operating profi t 2,102.0 2,691.3 4,793.3
2006:
Net revenues $ 3,691.3 $ 40,285.6 $ (155.5) $ 43,821.4
Gross profi t 458.8 11,283.4 11,742.2
Operating profi t 318.1 2,123.5 2,441.6
(1) Net revenues of the Pharmacy Services Segment include approximately $6,348.3 million and $4,618.2 million of Retail Co-Payments for 2008 and 2007,
respectively. Please see Note 1 to the consolidated fi nancial statements for additional information about Retail Co-Payments.
(2) Intersegment eliminations relate to intersegment revenues that occur when a Pharmacy Services Segment customer uses a Retail Pharmacy Segment store
to purchase covered products. When this occurs, both segments record the revenue on a standalone basis.
court order entered on October 16, 2008, Linens Holding Co. is in
the process of liquidating the entire Linens ‘n Things retail chain.
The Company’s loss from discontinued operations includes
$132.0 million (or $0.09 per diluted share) of lease-related
costs (consisting of $214.4 million of pre-tax lease-related
costs, net of an $82.4 million income tax benefi t), which the
Company believes it will likely be required to satisfy pursuant
to its Linens ‘n Things lease guarantees. These amounts, which
are expected to change as each lease is resolved, were calcu-
lated in accordance with Statement of Financial Accounting
Standards (“SFAS”) No. 146, “Accounting for Costs Associated
with Exit or Disposal Activities.” Please see Off-Balance Sheet
Arrangements later in this document for additional information
about our lease guarantees.
Net earnings increased $575.1 million or 21.8% to $3.2 billion
(or $2.18 per diluted share) in 2008. This compares to $2.6 bil-
lion (or $1.92 per diluted share) in 2007 and $1.4 billion (or
$1.60 per diluted share) in 2006.