CVS 2008 Annual Report Download - page 32
Download and view the complete annual report
Please find page 32 of the 2008 CVS annual report below. You can navigate through the pages in the report by either clicking on the pages listed below, or by using the keyword search tool below to find specific information within the annual report.-
 1
1 -
2
-
3
-
4
-
5
-
6
-
7
-
8
-
9
-
10
-
11
-
12
-
13
-
14
-
15
-
16
-
17
-
18
-
19
-
20
-
21
-
 22
22 -
 23
23 -
 24
24 -
 25
25 -
 26
26 -
 27
27 -
 28
28 -
 29
29 -
 30
30 -
 31
31 -
 32
32 -
 33
33 -
 34
34 -
 35
35 -
 36
36 -
 37
37 -
 38
38 -
 39
39 -
 40
40 -
 41
41 -
 42
42 -
43
-
44
-
45
-
46
-
47
-
48
-
49
-
50
-
51
-
52
-
53
-
54
-
55
-
56
-
57
-
58
-
59
-
60
-
61
-
62
-
63
-
64
-
65
-
66
-
67
-
68
-
69
-
70
-
71
-
72
-
73
-
74
 |
 |

28 CVS CAREMARK
Management’s Discussion and Analysis of Financial Condition
and Results of Operations
• Pharmacy revenue dollars continue to be negatively impacted in
all years by the conversion of brand named drugs to equivalent
generic drugs, which typically have a lower selling price. In
addition, our pharmacy growth has also been adversely affected
by a decline in utilization trends attributable to a weakening
economy which could continue in 2009, a decline in the
number of signifi cant new brand named drug introductions,
higher consumer co-payments and co-insurance arrangements,
and an increase in the number of over-the-counter remedies
that were historically only available by prescription.
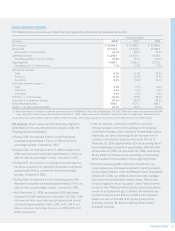
Gross profi t, which includes net revenues less the cost of
merchandise sold during the reporting period and the related
purchasing costs, warehousing costs, delivery costs and actual
and estimated inventory losses, as a percentage of net revenues
was 30.1% in 2008. This compares to 29.1% in 2007 and
28.0% in 2006.
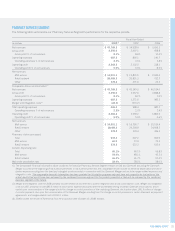
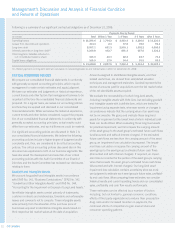
As you review our Retail Pharmacy Segment’s performance
in this area, we believe you should consider the following
important information:
• During 2008, our front store revenues increased to 32.5%
of total revenues, compared to 32.2% and 31.6% in 2007 and
2006, respectively. The increase in 2008 is primarily due to the
Longs Drug stores, which are larger than CVS/pharmacy stores
and devote more square footage to front store offerings, as well
as, the increase in generic drug revenues. On average, our
gross profi t on front store revenues is higher than our average
gross profi t on pharmacy revenues.
• During 2008, our front store gross profi t rate continued to benefi t
from improved product mix (including increases in private label
and proprietary brand product sales, which normally yield a
higher gross profi t rate than other front store products) and
benefi ts derived from our ExtraCare loyalty program.
• During 2008, our pharmacy gross profi t rate continued to
benefi t from a portion of the purchasing synergies resulting
from the Caremark Merger.
• During 2008, our pharmacy gross profi t rate continued to
benefi t from an increase in generic drug revenues, which
normally yield a higher gross profi t rate than equivalent brand
name drug revenues. However, the increased use of generic
drugs has augmented the efforts of third party payors to reduce
reimbursement payments to retail pharmacies for prescriptions.
This trend, which we expect to continue, reduces the benefi t
we realize from brand to generic product conversions.
• Sales to customers covered by third party insurance programs
have continued to increase and, thus, have become a larger
component of our total pharmacy business. On average, our
gross profi t on third party pharmacy revenues is lower than our
gross profi t on cash pharmacy revenues. Third party pharmacy
revenues were 96.1% of pharmacy revenues in 2008, compared
to 95.3% and 94.7% of pharmacy revenues in 2007 and 2006,
respectively. We expect this trend to continue.
• The Federal Government’s Medicare Part D benefi t is increasing
prescription utilization. However, it is also decreasing our
pharmacy gross profi t rates as our higher gross profi t business
(e.g., cash customers) continued to migrate to Part D coverage
during 2008.
• On February 8, 2006, the Defi cit Reduction Act of 2005 (the
“DRA”) was signed into law. The DRA seeks to reduce federal
spending by altering the Medicaid reimbursement formula for
multi-source (i.e., generic) drugs. According to the Congressional
Budget Offi ce, retail pharmacies are expected to negotiate
with individual states for higher dispensing fees to mitigate the
adverse effect of these changes. These changes were sched-
uled to begin to take effect during the fi rst quarter of 2007 and
were expected to result in reduced Medicaid reimbursement
rates for retail pharmacies.
During 2007, CMS issued a fi nal rule implementing provisions
under the DRA regarding prescription drugs under the Medicaid
program. Among other things, the rule defi nes AMP and “best
price,” and specifi es the items that must be included and
excluded in the calculation of each (the “AMP Rule”). Under
the AMP Rule, which became effective October 1, 2007, sales to
mail pharmacies would be included in the calculation of AMP, but
rebates and other discounts negotiated by PBMs in their capacity
as PBMs would be excluded. The rule also implements the DRA
provision establishing a new reimbursement formula for generic
drugs under Medicaid and establishes federal upper limits
(“FULs”) for generics based on 250 percent of the lowest AMP
in a given drug class. In December 2007, the U.S. District Court
for the District of Columbia preliminarily enjoined CMS from
implementing the AMP Rule to the extent such action affects
Medicaid reimbursement rates for retail pharmacies and from
posting online or disclosing any AMP data.
In October 2008, CMS issued a rule, subject to comment, which
modifi ed the defi nition of multiple source drugs, a component
of the AMP calculation, seeking to address one of the legal
challenges on which the injunction was issued. Plaintiffs in the
litigation responded with an amended complaint asserting that
the revised defi nition continues to be inconsistent with the DRA.
As a result of the above, we cannot currently determine the extent
or timing of any reductions in Medicaid reimbursement rates or
their future impact on the Company.