CVS 2008 Annual Report Download - page 62
Download and view the complete annual report
Please find page 62 of the 2008 CVS annual report below. You can navigate through the pages in the report by either clicking on the pages listed below, or by using the keyword search tool below to find specific information within the annual report.-
 1
1 -
2
-
3
-
4
-
5
-
6
-
7
-
8
-
9
-
10
-
11
-
12
-
13
-
14
-
15
-
16
-
17
-
18
-
19
-
20
-
21
-
22
-
23
-
24
-
25
-
26
-
27
-
28
-
29
-
30
-
31
-
32
-
33
-
34
-
35
-
36
-
37
-
38
-
39
-
40
-
41
-
42
-
43
-
44
-
45
-
46
-
47
-
48
-
49
-
50
-
51
-
 52
52 -
 53
53 -
 54
54 -
 55
55 -
 56
56 -
 57
57 -
 58
58 -
 59
59 -
 60
60 -
 61
61 -
 62
62 -
 63
63 -
 64
64 -
 65
65 -
 66
66 -
 67
67 -
 68
68 -
 69
69 -
 70
70 -
 71
71 -
 72
72 -
73
-
74
 |
 |

58 CVS CAREMARK
Notes to Consolidated Financial Statements
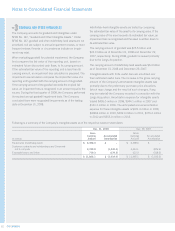
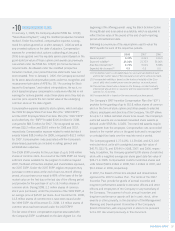
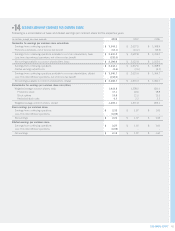
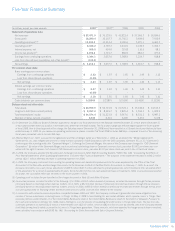
The fair value of each stock option is estimated using the
Black-Scholes Option Pricing Model based on the following
assumptions at the time of grant:
2008 2007 2006
Dividend yield(1) 0.60% 0.69% 0.50%
Expected volatility(2) 22.98% 23.84% 24.58%
Risk-free interest rate(3) 2.28% 4.49% 4.74%
Expected life (in years)(4) 4.3 5.1 4.2
Weighted average grant
date fair value $ 8.53 $ 8.29 $ 8.46
(1) The dividend yield is based on annual dividends paid and the fair market
value of the Company’s stock at the period end date.
(2) The expected volatility is estimated using the Company’s historical
volatility over a period equal to the expected life of each option grant after
adjustments for infrequent events such as stock splits.
(3) The risk-free interest rate is selected based on yields from U.S. Treasury
zero-coupon issues with a remaining term equal to the expected term of
the options being valued.
(4) The expected life represents the number of years the options are
expected to be outstanding from grant date based on historical option
holder exercise experience.
As of December 31, 2008, unrecognized compensation expense
related to unvested options totaled $150.7 million, which the
Company expects to be recognized over a weighted average
period of 1.75 years. After considering anticipated forfeitures,
the Company expects approximately 23.6 million of the unvested
options to vest over the requisite service period.
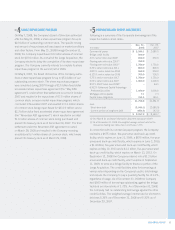
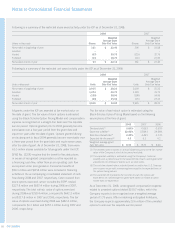
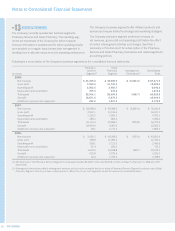
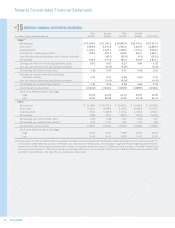
Following is a summary of the restricted share award activity under the ICP as of December 31, 2008:
2008 2007
Weighted Weighted
Average Grant Average Grant
Shares in thousands Shares Date Fair Value Shares Date Fair Value
Nonvested at beginning of year 161 $ 22.40 306 $ 22.08
Granted – – – –
Vested (67) 39.75 (129) 32.75
Forfeited (11) 18.75 (16) 22.00
Nonvested at end of year 83 $ 22.16 161 $ 22.40
Following is a summary of the restricted unit award activity under the ICP as of December 31, 2008:
2008 2007
Weighted Weighted
Average Grant Average Grant
Units in thousands Units Date Fair Value Units Date Fair Value
Nonvested at beginning of year 2,915 $ 28.23 2,009 $ 25.22
Granted 1,274 40.70 1,129 33.75
Vested (180) 38.96 (198) 34.99
Forfeited (40) 35.08 (25) 23.24
Nonvested at end of year 3,969 $ 32.08 2,915 $ 28.23
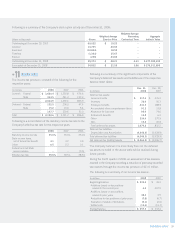
All grants under the ICP are awarded at fair market value on
the date of grant. The fair value of stock options is estimated
using the Black-Scholes Option Pricing Model and compensation
expense is recognized on a straight-line basis over the requisite
service period. Options granted prior to 2004 generally become
exercisable over a four-year period from the grant date and
expire ten years after the date of grant. Options granted during
and subsequent to fi scal 2004 generally become exercisable over
a three-year period from the grant date and expire seven years
after the date of grant. As of December 31, 2008, there were
61.0 million shares available for future grants under the ICP.
SFAS No. 123(R) requires that the benefi t of tax deductions
in excess of recognized compensation cost be reported as
a fi nancing cash fl ow, rather than as an operating cash fl ow
as required under prior guidance. Excess tax benefi ts of
$53.1 million and $97.8 million were included in fi nancing
activities in the accompanying consolidated statement of cash
fl ow during 2008 and 2007, respectively. Cash received from
stock options exercised, which includes the ESPP, totaled
$327.8 million and $552.4 million during 2008 and 2007,
respectively. The total intrinsic value of options exercised
during 2008 was $250.4 million, compared to $642.3 million
and $117.8 million in 2007 and 2006, respectively. The fair
value of options exercised during 2008 was $482.4 million,
compared to $1.2 billion and $257.1 million during 2007 and
2006, respectively.