CVS 2008 Annual Report Download - page 68
Download and view the complete annual report
Please find page 68 of the 2008 CVS annual report below. You can navigate through the pages in the report by either clicking on the pages listed below, or by using the keyword search tool below to find specific information within the annual report.-
 1
1 -
2
-
3
-
4
-
5
-
6
-
7
-
8
-
9
-
10
-
11
-
12
-
13
-
14
-
15
-
16
-
17
-
18
-
19
-
20
-
21
-
22
-
23
-
24
-
25
-
26
-
27
-
28
-
29
-
30
-
31
-
32
-
33
-
34
-
35
-
36
-
37
-
38
-
39
-
40
-
41
-
42
-
43
-
44
-
45
-
46
-
47
-
48
-
49
-
50
-
51
-
52
-
53
-
54
-
55
-
56
-
57
-
 58
58 -
 59
59 -
 60
60 -
 61
61 -
 62
62 -
 63
63 -
 64
64 -
 65
65 -
 66
66 -
 67
67 -
 68
68 -
 69
69 -
 70
70 -
 71
71 -
 72
72 -
 73
73 -
 74
74
 |
 |

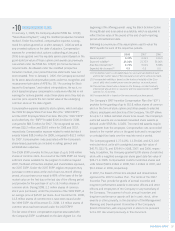
64 CVS CAREMARK
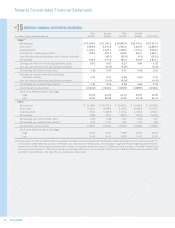
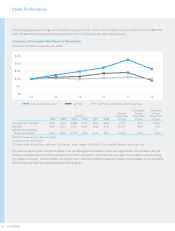
Notes to Consolidated Financial Statements
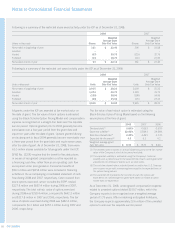
QUARTERLY FINANCIAL INFORMATION (UNAUDITED)
First Second Third Fourth
In millions, except per share amounts Quarter Quarter Quarter Quarter Fiscal Year
2008:(1)
Net revenues $ 21,326.0 $ 21,140.3 $ 20,863.4 $ 24,142.2 $ 87,471.9
Gross profi t 4,293.0 4,373.2 4,400.6 5,223.6 18,290.4
Operating profi t 1,370.1 1,478.1 1,466.2 1,731.8 6,046.2
Earnings from continuing operations 748.5 823.5 818.8 953.3 3,344.1
Loss from discontinued operations, net of income tax benefi t – (48.7) (82.8) (0.5) (132.0)
Net earnings 748.5 774.8 736.0 952.8 3,212.1
Earnings per share from continuing operations, basic 0.52 0.57 0.57 0.66 2.32
Loss per common share from discontinued operations – (0.03) (0.06) – (0.09)
Net earnings per common share, basic 0.52 0.54 0.51 0.66 2.23
Earnings per common share from continuing
operations, diluted 0.51 0.56 0.56 0.65 2.27
Loss per common share from discontinued operations – (0.03) (0.06) – (0.09)
Net earnings per common share, diluted 0.51 0.53 0.50 0.65 2.18
Dividends per common share 0.06000 0.06000 0.06900 0.06900 0.25800
Stock price: (New York Stock Exchange)
High 41.53 44.29 40.14 34.90 44.29
Low 34.91 39.02 31.81 23.19 23.19
2007:
Net revenues $ 13,188.6 $ 20,703.3 $ 20,495.2 $ 21,942.4 $ 76,329.5
Gross profi t 3,303.2 4,158.5 4,195.2 4,450.8 16,107.7
Operating profi t 736.5 1,309.8 1,271.1 1,475.9 4,793.3
Net earnings 408.9 723.6 689.5 815.0 2,637.0
Net earnings per common share, basic 0.45 0.48 0.47 0.56 1.97
Net earnings per common share, diluted 0.43 0.47 0.45 0.55 1.92
Dividends per common share 0.04875 0.06000 0.06000 0.06000 0.22875
Stock price: (New York Stock Exchange)
High 34.93 39.44 39.85 42.60 42.60
Low 30.45 34.14 34.80 36.43 30.45
(1) On December 23, 2008, our Board of Directors approved a change in our fi scal year-end from the Saturday nearest December 31 of each year to December 31
of each year to better refl ect our position in the health care, rather than the retail industry. The fi scal year change was effective beginning with the fourth
quarter of fi scal 2008. Prior to Board approval of this change, the Saturday nearest December 31, 2008 would have resulted in a 53-week fi scal year that
would have ended January 3, 2009. As you review our operating performance, please consider that fi scal years 2008 and 2007 and fi scal quarters 2008
and 2007 include 368 days, 364 days, 95 days and 91 days, respectively.
NO 15