CVS 2008 Annual Report Download - page 66
Download and view the complete annual report
Please find page 66 of the 2008 CVS annual report below. You can navigate through the pages in the report by either clicking on the pages listed below, or by using the keyword search tool below to find specific information within the annual report.-
 1
1 -
2
-
3
-
4
-
5
-
6
-
7
-
8
-
9
-
10
-
11
-
12
-
13
-
14
-
15
-
16
-
17
-
18
-
19
-
20
-
21
-
22
-
23
-
24
-
25
-
26
-
27
-
28
-
29
-
30
-
31
-
32
-
33
-
34
-
35
-
36
-
37
-
38
-
39
-
40
-
41
-
42
-
43
-
44
-
45
-
46
-
47
-
48
-
49
-
50
-
51
-
52
-
53
-
54
-
55
-
 56
56 -
 57
57 -
 58
58 -
 59
59 -
 60
60 -
 61
61 -
 62
62 -
 63
63 -
 64
64 -
 65
65 -
 66
66 -
 67
67 -
 68
68 -
 69
69 -
 70
70 -
 71
71 -
 72
72 -
 73
73 -
 74
74
 |
 |

62 CVS CAREMARK
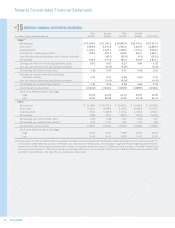
Notes to Consolidated Financial Statements
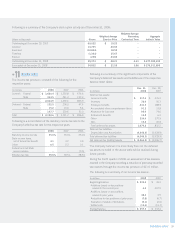
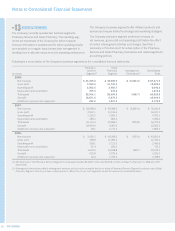
BUSINESS SEGMENTS
The Company currently operates two business segments:
Pharmacy Services and Retail Pharmacy. The operating seg-
ments are businesses of the Company for which separate
fi nancial information is available and for which operating results
are evaluated on a regular basis by executive management in
deciding how to allocate resources and in assessing performance.
The Company’s business segments offer different products and
services and require distinct technology and marketing strategies.
The Company evaluates segment performance based on
net revenues, gross profi t and operating profi t before the effect
of certain intersegment activities and charges. See Note 1
previously in this document for a description of the Pharmacy
Services and Retail Pharmacy businesses and related signifi cant
accounting policies.
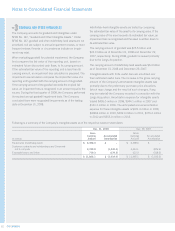
Following is a reconciliation of the Company’s business segments to the consolidated fi nancial statements:
Pharmacy Retail
Services Pharmacy Intersegment Consolidated
In millions Segment(1) Segment Eliminations(2) Totals
2008:
Net revenues $ 43,769.2 $ 48,989.9 $ (5,287.2) $ 87,471.9
Gross profi t 3,550.0 14,740.4 18,290.4
Operating profi t 2,562.5 3,483.7 6,046.2
Depreciation and amortization 355.0 919.2 1,274.2
Total assets 32,904.1 28,404.5 (348.7) 60,959.9
Goodwill 18,817.6 6,676.3 25,493.9
Additions to property and equipment 252.9 1,927.0 2,179.9
2007:
Net revenues $ 34,938.4 $ 45,086.5 $ (3,695.4) $ 76,329.5
Gross profi t 2,997.1 13,110.6 16,107.7
Operating profi t 2,102.0 2,691.3 4,793.3
Depreciation and amortization 289.3 805.3 1,094.6
Total assets 32,133.4 22,844.3 (255.8) 54,721.9
Goodwill 18,454.9 5,467.4 23,922.3
Additions to property and equipment 94.1 1,711.2 1,805.3
2006:
Net revenues $ 3,691.3 $ 40,285.6 $ (155.5) $ 43,821.4
Gross profi t 458.8 11,283.4 11,742.2
Operating profi t 318.1 2,123.5 2,441.6
Depreciation and amortization 41.4 691.9 733.3
Total assets 1,603.4 19,038.8 (68.1) 20,574.1
Goodwill 622.8 2,572.4 3,195.2
Additions to property and equipment 18.4 1,750.5 1,768.9
(1) Net Revenues of the Pharmacy Services Segment include approximately $6,348.3 million and $4,618.2 million of Retail Co-Payments in 2008 and 2007
respectively.
(2) Intersegment eliminations relate to intersegment revenues and accounts receivable that occur when a Pharmacy Services Segment customer uses a Retail
Pharmacy Segment store to purchase covered products. When this occurs, both segments record the revenue on a standalone basis.
NO 13