CVS 2008 Annual Report Download - page 63
Download and view the complete annual report
Please find page 63 of the 2008 CVS annual report below. You can navigate through the pages in the report by either clicking on the pages listed below, or by using the keyword search tool below to find specific information within the annual report.-
 1
1 -
2
-
3
-
4
-
5
-
6
-
7
-
8
-
9
-
10
-
11
-
12
-
13
-
14
-
15
-
16
-
17
-
18
-
19
-
20
-
21
-
22
-
23
-
24
-
25
-
26
-
27
-
28
-
29
-
30
-
31
-
32
-
33
-
34
-
35
-
36
-
37
-
38
-
39
-
40
-
41
-
42
-
43
-
44
-
45
-
46
-
47
-
48
-
49
-
50
-
51
-
52
-
 53
53 -
 54
54 -
 55
55 -
 56
56 -
 57
57 -
 58
58 -
 59
59 -
 60
60 -
 61
61 -
 62
62 -
 63
63 -
 64
64 -
 65
65 -
 66
66 -
 67
67 -
 68
68 -
 69
69 -
 70
70 -
 71
71 -
 72
72 -
 73
73 -
74
 |
 |

2008 ANNUAL REPORT 59
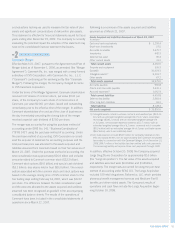
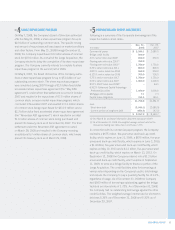
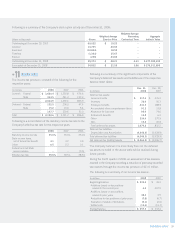
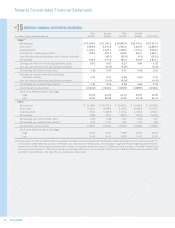
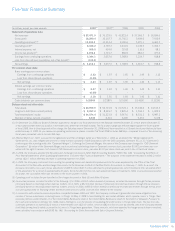
Following is a summary of the Company’s stock option activity as of December 31, 2008:
Weighted Average
Weighted Average Remaining Aggregate
Shares in thousands Shares Exercise Price Contractual Term Intrinsic Value
Outstanding at December 29, 2007 60,022 $ 19.23 – –
Granted 13,735 40.69 – –
Exercised (12,844) 18.59 – –
Forfeited (1,303) 35.67 – –
Expired (236) 23.82 – –
Outstanding at December 31, 2008 59,374 $ 28.21 4.63 $ 277,599,232
Exercisable at December 31, 2008 34,832 $ 21.55 3.86 $ 276,911,898
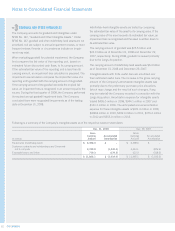
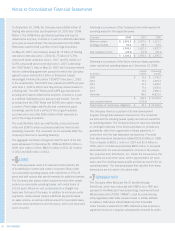
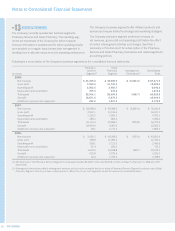
INCOME TAXES
The income tax provision consisted of the following for the
respective years:
In millions 2008 2007 2006
Current: Federal $ 1,680.4 $ 1,250.8 $ 676.6
State
364.5 241.3 127.3
2,044.9 1,492.1 803.9
Deferred: Federal 132.5 206.0 47.6
State
15.2 23.6 5.4
147.7 229.6 53.0
Total $ 2,192.6 $ 1,721.7 $ 856.9
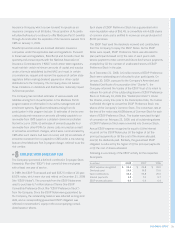
Following is a reconciliation of the statutory income tax rate to the
Company’s effective tax rate for the respective years:
2008 2007 2006
Statutory income tax rate 35.0% 35.0% 35.0%
State income taxes,
net of federal tax benefi t 4.1 4.2 3.9
Other
0.5 0.3 0.1
Federal and net State
reserve release – – (0.5)
Effective tax rate 39.6% 39.5% 38.5%
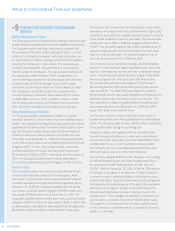
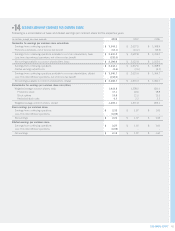
Following is a summary of the signifi cant components of the
Company’s deferred tax assets and liabilities as of the respective
balance sheet dates:
Dec. 31, Dec. 29,
In millions 2008 2007
Deferred tax assets:
Lease and rents $ 317.6 $ 276.2
Inventory 72.9 56.7
Employee benefi ts 241.3 188.9
Accumulated other comprehensive items 91.2 31.8
Allowance for bad debt 95.4 74.6
Retirement benefi ts 13.8 6.2
Other 234.4 170.9
NOL 13.2 26.9
Total deferred tax assets 1,079.8 832.2
Deferred tax liabilities:
Depreciation and Amortization (4,346.3) (3,928.9)
Total deferred tax liabilities (4,346.3) (3,928.9)
Net deferred tax (liability)/assets $ (3,266.5) $ (3,096.7)
The Company believes it is more likely than not the deferred
tax assets included in the above table will be realized during
future periods.
During the fourth quarter of 2006, an assessment of tax reserves
resulted in the Company recording a reduction of previously recorded
tax reserves through the income tax provision of $11.0 million.
The following is a summary of our income tax reserve:
In millions 2008 2007
Beginning Balance $ 233.4 $ 43.2
Additions based on tax positions
related to the current year 6.0 207.5
Additions based on tax positions
related to prior years 48.4 4.5
Reductions for tax positions of prior years (7.8) (6.7)
Expiration of statute of limitations (9.1) (2.0)
Settlements (13.6) (13.1)
Ending Balance $ 257.3 $ 233.4
NO 11