CVS 2008 Annual Report Download - page 31
Download and view the complete annual report
Please find page 31 of the 2008 CVS annual report below. You can navigate through the pages in the report by either clicking on the pages listed below, or by using the keyword search tool below to find specific information within the annual report.-
 1
1 -
2
-
3
-
4
-
5
-
6
-
7
-
8
-
9
-
10
-
11
-
12
-
13
-
14
-
15
-
16
-
17
-
18
-
19
-
20
-
 21
21 -
 22
22 -
 23
23 -
 24
24 -
 25
25 -
 26
26 -
 27
27 -
 28
28 -
 29
29 -
 30
30 -
 31
31 -
 32
32 -
 33
33 -
 34
34 -
 35
35 -
 36
36 -
 37
37 -
 38
38 -
 39
39 -
 40
40 -
 41
41 -
42
-
43
-
44
-
45
-
46
-
47
-
48
-
49
-
50
-
51
-
52
-
53
-
54
-
55
-
56
-
57
-
58
-
59
-
60
-
61
-
62
-
63
-
64
-
65
-
66
-
67
-
68
-
69
-
70
-
71
-
72
-
73
-
74
 |
 |

2008 ANNUAL REPORT 27
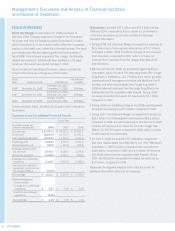
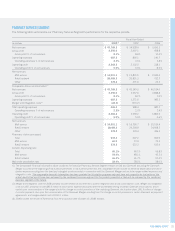
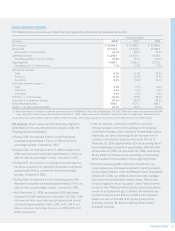
RETAIL PHARMACY SEGMENT
The following table summarizes our Retail Pharmacy Segment’s performance for the respective periods:
Fiscal Year Ended
In millions 2008(2) 2007 2006
Net revenues $ 48,989.9 $ 45,086.5 $ 40,285.6
Gross profi t
14,740.4 13,110.6 11,283.4
Gross profi t % of net revenues 30.1% 29.1% 28.0%
Operating expenses
11,256.7 10,419.3 9,159.9
Operating expenses % of net revenues 23.0% 23.1% 22.7%
Operating profi t 3,483.7 2,691.3 2,123.5
Operating profi t % of net revenues 7.1% 6.0% 5.3%
Net revenue increase:
Total 8.7% 11.9% 18.2%
Pharmacy 8.1% 10.9% 17.9%
Front Store 9.9% 14.0% 18.7%
Same store revenue increase:(1)
Total 4.5% 5.3% 8.1%
Pharmacy 4.8% 5.2% 9.0%
Front Store 3.6% 5.3% 6.2%
Pharmacy % of net revenues 67.5% 67.8% 68.4%
Third party % of pharmacy revenue 96.1% 95.3% 94.7%
Retail prescriptions fi lled 559.0 527.5 481.7
Generic % of retail prescriptions fi lled 67.4% 63.2% 59.1%
(1) Same store revenue increase includes the stores acquired in the Albertson’s Acquisition beginning in July 2007. Same store revenue increase excludes the
Longs Drug Stores, which were acquired effective October 20, 2008. These stores will be included in same store revenues beginning in November 2009.
(2) Except as discussed in Note (1) above, 2008 includes the results of the Longs Drug stores from the acquisition date (October 20, 2008) forward.
Net revenues. As you review our Retail Pharmacy Segment’s
performance in this area, we believe you should consider the
following important information:
• During 2008, net revenues from the Longs Drug Stores
contributed approximately 2.2% to our total net revenue
percentage increase, compared to 2007.
• During 2008, net revenues from the 4 additional days in the
2008 reporting period contributed approximately 1.3% to our
total net revenue percentage increase, compared to 2007.
• During 2007, the inclusion of a full year of net revenues from
the stores acquired in the Albertson’s Acquisition contributed
approximately 4.9% to our total net revenue percentage
increase, compared to 2006.
• During 2006, net revenues from the stores acquired in the
Albertson’s Acquisition contributed approximately 8.7% to our
total net revenue percentage increase, compared to 2005.
• As of December 31, 2008, we operated 6,923 retail stores,
compared to 6,245 retail stores on December 29, 2007. Total
net revenues from new stores (excluding acquired stores)
contributed approximately 1.5%, 1.3%, and 1.3% to our
total net revenue percentage increase in 2008, 2007 and
2006, respectively.
• Total net revenues continued to benefi t from our active
relocation program, which moves existing in-line shopping
center stores to larger, more convenient, freestanding locations.
Historically, we have achieved signifi cant improvements in
customer count and net revenue when we do this. As of
December 31, 2008, approximately 62% of our existing stores
were freestanding, compared to approximately 64% and 61%
at December 29, 2007 and December 30, 2006, respectively.
During 2008, the decrease in the percentage of freestanding
stores resulted from the addition of the Longs Drug Stores.
• Pharmacy revenue growth continued to benefi t from new
market expansions, increased penetration in existing markets,
the increased utilization under the Medicare Part D drug benefi t
introduced in 2006, our ability to attract and retain managed
care customers and favorable industry trends. These trends
include an aging American population; many “baby boomers”
are now in their fi fties and sixties and are consuming a greater
number of prescription drugs. In addition, the increased use
of pharmaceuticals as the fi rst line of defense for individual
health care also contributed to the growing demand for
pharmacy services. We believe these favorable industry
trends will continue.