CVS 2008 Annual Report Download - page 30
Download and view the complete annual report
Please find page 30 of the 2008 CVS annual report below. You can navigate through the pages in the report by either clicking on the pages listed below, or by using the keyword search tool below to find specific information within the annual report.-
 1
1 -
2
-
3
-
4
-
5
-
6
-
7
-
8
-
9
-
10
-
11
-
12
-
13
-
14
-
15
-
16
-
17
-
18
-
19
-
 20
20 -
 21
21 -
 22
22 -
 23
23 -
 24
24 -
 25
25 -
 26
26 -
 27
27 -
 28
28 -
 29
29 -
 30
30 -
 31
31 -
 32
32 -
 33
33 -
 34
34 -
 35
35 -
 36
36 -
 37
37 -
 38
38 -
 39
39 -
 40
40 -
41
-
42
-
43
-
44
-
45
-
46
-
47
-
48
-
49
-
50
-
51
-
52
-
53
-
54
-
55
-
56
-
57
-
58
-
59
-
60
-
61
-
62
-
63
-
64
-
65
-
66
-
67
-
68
-
69
-
70
-
71
-
72
-
73
-
74
 |
 |

26 CVS CAREMARK
Management’s Discussion and Analysis of Financial Condition
and Results of Operations
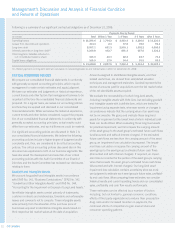
Total operating expenses, which include selling, general and
administrative expenses (including integration and other merger-
related expenses), depreciation and amortization related to
selling, general and administrative activities and retail specialty
pharmacy store and administrative payroll, employee benefi ts and
occupancy costs decreased to 2.3% of net revenues in 2008,
compared to 2.6% and 3.8% in 2007 and 2006, respectively.
As you review our Pharmacy Services Segment’s performance
in this area, we believe you should consider the following
important information:
• During 2008 and 2007, the Caremark Merger signifi cantly
affected our total operating expenses. Total operating expenses
for 2008 include $18.6 million of integration and other related
expenses and $209.1 million of amortization expense resulting
from the intangible assets recorded in connection with the
Caremark Merger. Total operating expenses for 2007 include
$81.7 million of merger, integration and other related expenses
and $162.6 million of incremental amortization expense resulting
from the intangible assets recorded in connection with the
Caremark Merger.
• During 2008, comparable total operating expenses decreased
3.3% to $965.2 million (or 2.2% of net revenues), compared
to $998.4 million (or 2.3% of net revenues) and $982.2 million
(or 2.4% of net revenues) during 2007 and 2006, respectively.
As noted previously in this document, our comparable results
include incremental depreciation and amortization expense
resulting from the fi xed and intangible assets recorded in
connection with the Caremark Merger, but exclude merger-
related expenses and integration costs.
• Our comparable gross profi t rates were impacted by decreases
in our mail penetration rate to 22.9% in 2008, compared to 28.2%
and 28.0% in 2007 and 2006, respectively. This and the impact
of accounting for certain PharmaCare contracts using the gross
method were offset, in part, by increases in revenues from generic
drugs, which normally yield a higher gross profi t rate than equivalent
brand name drugs. Our comparable total generic dispensing rate
increased to 65.1% in 2008, compared to 60.1% and 55.8% in
2007 and 2006, respectively.
• During 2008 and 2007, our comparable gross profi t rates
benefi ted from the purchasing synergies resulting from the
Caremark Merger.
• Our gross profi t dollars and gross profi t rates continued to
be impacted by our efforts to (i) retain existing customers,
(ii) obtain new business, and (iii) maintain or improve the
purchase discounts we received from manufacturers, whole-
salers and retail pharmacies. In that regard, during the 2008
selling season, the Company renewed a number of existing
clients and obtained new clients at lower rates, which will
result in additional gross profi t compression in 2009.