CVS 2008 Annual Report Download - page 45
Download and view the complete annual report
Please find page 45 of the 2008 CVS annual report below. You can navigate through the pages in the report by either clicking on the pages listed below, or by using the keyword search tool below to find specific information within the annual report.-
 1
1 -
2
-
3
-
4
-
5
-
6
-
7
-
8
-
9
-
10
-
11
-
12
-
13
-
14
-
15
-
16
-
17
-
18
-
19
-
20
-
21
-
22
-
23
-
24
-
25
-
26
-
27
-
28
-
29
-
30
-
31
-
32
-
33
-
34
-
 35
35 -
 36
36 -
 37
37 -
 38
38 -
 39
39 -
 40
40 -
 41
41 -
 42
42 -
 43
43 -
 44
44 -
 45
45 -
 46
46 -
 47
47 -
 48
48 -
 49
49 -
 50
50 -
 51
51 -
 52
52 -
 53
53 -
 54
54 -
 55
55 -
56
-
57
-
58
-
59
-
60
-
61
-
62
-
63
-
64
-
65
-
66
-
67
-
68
-
69
-
70
-
71
-
72
-
73
-
74
 |
 |

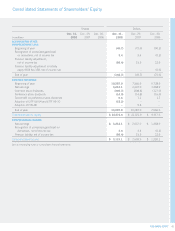
2008 ANNUAL REPORT 41
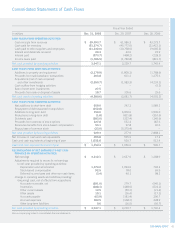
Consolidated Statements of Cash Flows
Fiscal Year Ended
In millions Dec. 31, 2008 Dec. 29, 2007 Dec. 30, 2006
CASH FLOWS FROM OPERATING ACTIVITIES:
Cash receipts from revenues $ 69,493.7 $ 61,986.3 $ 43,273.7
Cash paid for inventory (51,374.7) (45,772.6) (31,422.1)
Cash paid to other suppliers and employees (11,832.0) (10,768.6) (9,065.3)
Interest and dividends received 20.3 33.6 15.9
Interest paid (573.7) (468.2) (228.1)
Income taxes paid (1,786.5) (1,780.8) (831.7)
Net cash provided by operating activities 3,947.1 3,229.7 1,742.4
CASH FLOWS FROM INVESTING ACTIVITIES:
Additions to property and equipment (2,179.9) (1,805.3) (1,768.9)
Proceeds from sale-leaseback transactions 203.8 601.3 1,375.6
Acquisitions (net of cash acquired)
and other investments (2,650.7) (1,983.3) (4,224.2)
Cash outfl ow from hedging activities – – (5.3)
Sale of short-term investments 27.5 – –
Proceeds from sale or disposal of assets 18.7 105.6 29.6
Net cash used in investing activities (4,580.6) (3,081.7) (4,593.2)
CASH FLOWS FROM FINANCING ACTIVITIES:
Net additions to short-term debt 959.0 242.3 1,589.3
Repayment of debt assumed in acquisition (352.8) – –
Additions to long-term debt 350.0 6,000.0 1,500.0
Reductions in long-term debt (1.8) (821.8) (310.5)
Dividends paid (383.0) (322.4) (140.9)
Proceeds from exercise of stock options 327.8 552.4 187.6
Excess tax benefi ts from stock-based compensation 53.1 97.8 42.6
Repurchase of common stock (23.0) (5,370.4) –
Net cash provided by fi nancing activities 929.3 377.9 2,868.1
Net increase in cash and cash equivalents 295.8 525.9 17.3
Cash and cash equivalents at beginning of year 1,056.6 530.7 513.4
Cash and cash equivalents at end of year $ 1,352.4 $ 1,056.6 $ 530.7
RECONCILIATION OF NET EARNINGS TO NET CASH
PROVIDED BY OPERATING ACTIVITIES:
Net earnings $ 3,212.1 $ 2,637.0 $ 1,368.9
Adjustments required to reconcile net earnings
to net cash provided by operating activities:
Depreciation and amortization 1,274.2 1,094.6 733.3
Stock-based compensation 92.5 78.0 69.9
Deferred income taxes and other non-cash items (3.4) 40.1 98.2
Change in operating assets and liabilities providing/
(requiring) cash, net of effects from acquisitions:
Accounts receivable, net (291.0) 279.7 (540.1)
Inventories (488.1) (448.0) (624.1)
Other current assets 12.5 (59.2) (21.4)
Other assets 19.1 (26.4) (17.2)
Accounts payable (63.9) (181.4) 396.7
Accrued expenses 182.5 (168.2) 328.9
Other long-term liabilities 0.6 (16.5) (50.7)
Net cash provided by operating activities $ 3,947.1 $ 3,229.7 $ 1,742.4
See accompanying notes to consolidated fi nancial statements.