CVS 2008 Annual Report Download - page 29
Download and view the complete annual report
Please find page 29 of the 2008 CVS annual report below. You can navigate through the pages in the report by either clicking on the pages listed below, or by using the keyword search tool below to find specific information within the annual report.-
 1
1 -
2
-
3
-
4
-
5
-
6
-
7
-
8
-
9
-
10
-
11
-
12
-
13
-
14
-
15
-
16
-
17
-
18
-
 19
19 -
 20
20 -
 21
21 -
 22
22 -
 23
23 -
 24
24 -
 25
25 -
 26
26 -
 27
27 -
 28
28 -
 29
29 -
 30
30 -
 31
31 -
 32
32 -
 33
33 -
 34
34 -
 35
35 -
 36
36 -
 37
37 -
 38
38 -
 39
39 -
40
-
41
-
42
-
43
-
44
-
45
-
46
-
47
-
48
-
49
-
50
-
51
-
52
-
53
-
54
-
55
-
56
-
57
-
58
-
59
-
60
-
61
-
62
-
63
-
64
-
65
-
66
-
67
-
68
-
69
-
70
-
71
-
72
-
73
-
74
 |
 |

2008 ANNUAL REPORT 25
and UAC dissolved this joint venture at the end of 2008 and
have divided the responsibility for providing Medicare Part D
services to the affected plan members beginning with the
2009 plan year. In addition, we assist employer, union and other
health plan clients that qualify for the retiree drug subsidy under
Medicare Part D by collecting eligibility data from and submitting
drug cost data to CMS in order for them to obtain the subsidy.
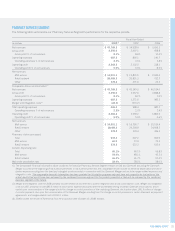
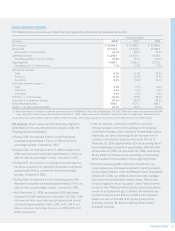
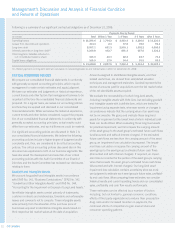
Gross profi t includes net revenues less cost of revenues. Cost
of revenues includes (i) the cost of pharmaceuticals dispensed,
either directly through our mail service and specialty retail
pharmacies or indirectly through our national retail pharmacy
network, (ii) shipping and handling costs and (iii) the operating
costs of our mail service pharmacies, customer service operations
and related information technology support. Gross profi t as a
percentage of revenues was 8.1%, 8.6% and 12.4% in 2008,
2007 and 2006, respectively.
During 2008 and 2007, the Caremark Merger signifi cantly affected
our gross profi t dollars and gross profi t rates. As you review our
Pharmacy Services Segment’s performance in this area, we believe
you should consider the following important information:
• Our comparable gross profi t as a percentage of total net
revenues was 8.1%, 8.2% and 7.0% during 2008, 2007
and 2006, respectively.
• As discussed previously in this document, we review our
national retail network contracts on an individual basis to
determine if the related revenues should be accounted for
using the gross method or net method under the applicable
accounting rules. Under these rules, the majority of Caremark’s
national retail network contracts are accounted for using the
gross method, which results in higher revenues, higher cost
of revenues and lower gross profi t rates. The conversion of
certain PharmaCare contracts to the Caremark contract
structure increased our net revenues, increased our cost of
revenues and lowered our gross profi t rates. Although this
change did not affect our gross profi t dollars, it did reduce
our gross profi t rates by approximately 35 basis points and
20 basis points during 2008 and 2007, respectively.
• During 2008, our comparable average revenue per retail
network claim processed increased by 1.2%, compared to
2007. This increase was primarily due to the change in the
revenue recognition method from net to gross for certain
PharmaCare contracts (discussed previously in this docu-
ment) and higher drug costs, which normally result in higher
claim revenues. These factors increased our average revenue
per retail network claim by approximately 6.6%. These
increases were offset, in part by (i) the inclusion of RxAmerica’s
results (beginning October 20, 2008), which decreased our
average revenue per retail network claim by 2.1%, (ii) customer
pricing, (iii) claims mix and (iv) an increase in the percentage of
generic drugs dispensed.
• During 2007, our comparable average revenue per retail
network claim processed increased by 6.2%, compared to
2006. This increase was primarily due to the change in the
revenue recognition method from net to gross for certain
PharmaCare contracts (discussed previously in this docu-
ment), one additional contract in the second quarter of 2006
and higher drug costs, which normally result in higher claim
revenues. These increases were offset, in part, by an increase
in the percentage of generic drugs dispensed.
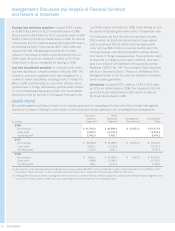
• During 2008, our comparable retail network generic dispensing
rates increased to 66.2%, compared to 61.7% and 57.4% in
2007 and 2006, respectively. These increases were primarily
due to new generic drug introductions and our continued efforts
to encourage plan participants to use generic drugs when they
are available. We believe our generic dispensing rates will
continue to increase in future periods. This increase will be
affected by, among other things, the number of new generic
drug introductions and our success at encouraging plan
participants to utilize generic drugs when they are available.
• During 2008 and 2007, our net revenues benefi ted from our
participation in the administration of the Medicare Part D drug
benefi t by providing PBM services to our health plan clients
and other clients that have qualifi ed as a Medicare Part D
Prescription Drug Plan (a “PDP”). We are also a national
provider of drug benefi ts to eligible benefi ciaries under the
Medicare Part D program through our subsidiaries, SilverScript
and Accendo (which have been approved by CMS as PDPs),
and through a joint venture with Universal American Corp.
(“UAC”), which sponsored a CMS approved PDP. The Company