CVS 2008 Annual Report Download - page 28
Download and view the complete annual report
Please find page 28 of the 2008 CVS annual report below. You can navigate through the pages in the report by either clicking on the pages listed below, or by using the keyword search tool below to find specific information within the annual report.-
 1
1 -
2
-
3
-
4
-
5
-
6
-
7
-
8
-
9
-
10
-
11
-
12
-
13
-
14
-
15
-
16
-
17
-
 18
18 -
 19
19 -
 20
20 -
 21
21 -
 22
22 -
 23
23 -
 24
24 -
 25
25 -
 26
26 -
 27
27 -
 28
28 -
 29
29 -
 30
30 -
 31
31 -
 32
32 -
 33
33 -
 34
34 -
 35
35 -
 36
36 -
 37
37 -
 38
38 -
39
-
40
-
41
-
42
-
43
-
44
-
45
-
46
-
47
-
48
-
49
-
50
-
51
-
52
-
53
-
54
-
55
-
56
-
57
-
58
-
59
-
60
-
61
-
62
-
63
-
64
-
65
-
66
-
67
-
68
-
69
-
70
-
71
-
72
-
73
-
74
 |
 |

24 CVS CAREMARK
Management’s Discussion and Analysis of Financial Condition
and Results of Operations
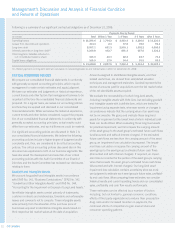
• During 2008, the 4 additional days in the 2008 reporting period
increased our total net revenue by approximately $495 million,
compared to 2007.
• During 2008, our comparable mail service claims processed
decreased 17.6% to 60.9 million claims, compared to 73.9 million
claims in 2007. This decrease was primarily due to the termina-
tion of the Federal Employees Health Benefi t Plan (“FEP”) mail
contract on December 31, 2007. During 2007, our comparable
mail service claims increased 0.9% to 73.9 million claims,
compared to 73.3 million claims in 2006.
• During 2008 and 2007, our comparable average revenue per
mail service claim increased by 7.8% and 7.2%, compared to
2007 and 2006, respectively. These increases were primarily
due to an increase in specialty mail service claims (which
have signifi cantly higher average net revenues per claim) and
higher drug costs. This was offset, in part, by an increase in
the percentage of generic drugs dispensed and changes in
client pricing.
• During 2008 and 2007, our comparable mail service generic
dispensing rates increased to 54.4% and 48.1%, compared to
2007 and 2006, respectively. These increases were primarily
due to new generic drug introductions and our continued efforts
to encourage plan participants to use generic drugs when
they are available. In addition, the termination of the FEP mail
contract caused our comparable mail service generic dispens-
ing rate to increase by approximately 120 basis points during
2008, compared to 2007.
• During 2008, our comparable retail network claims processed
increased to 572.5 million, compared to 533.3 million and
532.6 million in 2007 and 2006, respectively. These increases
were primarily due to the addition of approximately 13.5 million
RxAmerica claims (beginning October 20, 2008), growth in our
existing business (including our Medicare Part D business), the
4 additional days in the 2008 reporting period and new clients.
During 2008 and 2007, the Pharmacy Services Segment’s
results of operations were signifi cantly affected by the Caremark
Merger. As such, the primary focus of our Pharmacy Services
Segment discussion is based on the comparable fi nancial
information presented previously in this document. Prior to the
Caremark Merger, our pharmacy services business did not meet
the threshold for separate disclosure and the trends for the
pharmacy services business, which included our PharmaCare
Management Services, L.L.C. (“PharmaCare”) subsidiary, did
not differ materially from the trends of the consolidated Company.
Consequently, we do not believe that a comparison of the
historical fi nancial results provides meaningful information.
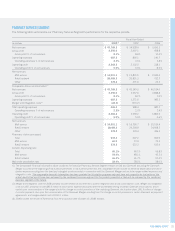
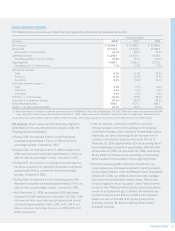
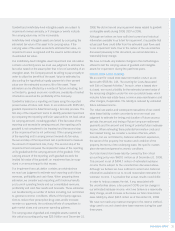
Net revenues. As you review our Pharmacy Services Segment’s
revenue performance, we believe you should consider the
following important information:
• During 2008 and 2007, the Caremark Merger increased
net revenues by $7.9 billion and $29.8 billion, compared to
2007 and 2006, respectively. 2008 includes a full year of net
revenues from Caremark, compared to 2007, which includes
net revenues from Caremark from the merger date (March 22,
2007) forward. 2006 includes no net revenues from Caremark.
• The Pharmacy Services Segment recognizes revenues for
its national retail pharmacy network transactions based on
individual contract terms. In accordance with Emerging Issues
Task Force Issue (“EITF”) No. 99-19, “Reporting Revenue
Gross as a Principal versus Net as an Agent,” Caremark’s
contracts are predominantly accounted for using the gross
method. Prior to September 2007, PharmaCare’s contracts
were accounted for using the net method. Effective September
1, 2007, we converted a number PharmaCare’s retail pharmacy
network contracts to the Caremark contract structure, which
resulted in those contracts being accounted for using the gross
method. As a result, net revenues increased by approximately
$1.8 billion and $1.0 billion during 2008 and 2007, compared
to 2007 and 2006, respectively. RxAmerica’s contracts are also
accounted for using the net method. We expect to convert a
number of RxAmerica’s contracts to the Caremark contract
structure during 2009. See Note 1 to the consolidated fi nancial
statements for additional information about the Pharmacy
Services Segment’s revenue recognition policies.