CVS 2008 Annual Report Download - page 24
Download and view the complete annual report
Please find page 24 of the 2008 CVS annual report below. You can navigate through the pages in the report by either clicking on the pages listed below, or by using the keyword search tool below to find specific information within the annual report.-
 1
1 -
2
-
3
-
4
-
5
-
6
-
7
-
8
-
9
-
10
-
11
-
12
-
13
-
 14
14 -
 15
15 -
 16
16 -
 17
17 -
 18
18 -
 19
19 -
 20
20 -
 21
21 -
 22
22 -
 23
23 -
 24
24 -
 25
25 -
 26
26 -
 27
27 -
 28
28 -
 29
29 -
 30
30 -
 31
31 -
 32
32 -
 33
33 -
 34
34 -
35
-
36
-
37
-
38
-
39
-
40
-
41
-
42
-
43
-
44
-
45
-
46
-
47
-
48
-
49
-
50
-
51
-
52
-
53
-
54
-
55
-
56
-
57
-
58
-
59
-
60
-
61
-
62
-
63
-
64
-
65
-
66
-
67
-
68
-
69
-
70
-
71
-
72
-
73
-
74
 |
 |

20 CVS CAREMARK
Management’s Discussion and Analysis of Financial Condition
and Results of Operations
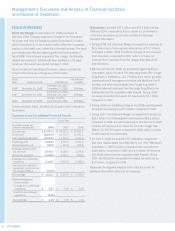
RESULTS OF OPERATIONS
Fiscal Year Change. On December 23, 2008, the Board of
Directors of the Company approved a change in the Company’s
fi scal year end from the Saturday nearest December 31 of each
year to December 31 of each year to better refl ect the Company’s
position in the health care, rather than the retail industry. The fi scal
year change was effective beginning with the fourth quarter of
fi scal 2008. Prior to Board approval of this change, the Saturday
nearest December 31, 2008 would have resulted in a 53-week
fi scal year that would have ended January 3, 2009.
As you review our operating performance, please consider the
impact of the fi scal year change as set forth below:
Fiscal Fiscal Period
Year Fiscal Year-End Fiscal Period Includes
December 30, 2007 –
2008 December 31, 2008 December 31, 2008 368 days
December 31, 2006 –
2007 December 29, 2007 December 29, 2007 364 days
January 1, 2006 –
2006 December 30, 2006 December 30, 2006 364 days
Unless otherwise noted, all references to years relate to the above
fi scal years.
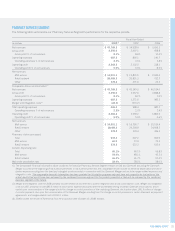
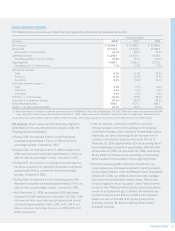
Summary of our Consolidated Financial Results
Fiscal Year
In millions, except per
common share amounts 2008 2007 2006
Net revenues $ 87,471.9 $ 76,329.5 $ 43,821.4
Gross profi t 18,290.4 16,107.7 11,742.2
Total operating expenses 12,244.2 11,314.4 9,300.6
Operating profi t 6,046.2 4,793.3 2,441.6
Interest expense, net 509.5 434.6 215.8
Earnings before income
tax provision 5,536.7 4,358.7 2,225.8
Income tax provision 2,192.6 1,721.7 856.9
Earnings from continuing
operations 3,344.1 2,637.0 1,368.9
Loss from discontinued
operations, net of income
tax benefi t of $82.4 (132.0) – –
Net earnings $ 3,212.1 $ 2,637.0 $ 1,368.9
Diluted earnings per
common share:
Earnings from continuing
operations $ 2.27 $ 1.92 $ 1.60
Loss from discontinued
operations (0.09) – –
Net earnings $ 2.18 $ 1.92 $ 1.60
Net revenues increased $11.1 billion and $32.5 billion during
2008 and 2007, respectively. As you review our performance
in this area, we believe you should consider the following
important information:
• During 2008, the Caremark Merger increased net revenues by
$6.9 billion (net of intersegment eliminations of $1.0 billion),
compared to 2007. 2008 includes a full year of net revenues
from Caremark, compared to 2007, which includes net
revenues from Caremark from the merger date (March 22,
2007) forward.
• Effective October 20, 2008, we acquired Longs Drug Stores
Corporation, which included 529 retail drug stores (the “Longs
Drug Stores”), RxAmerica, LLC (“RxAmerica”), which provides
pharmacy benefi t management services and Medicare Part D
benefi ts, and other related assets (the “Longs Acquisition”).
2008 includes net revenues from the Longs Drug Stores and
RxAmerica from the acquisition date forward. During 2008,
the Longs Acquisition increased net revenues by $1.1 billion,
compared to 2007.
• During 2008, the 4 additional days in the 2008 reporting period
increased net revenues by $1.1 billion, compared to 2007.
• During 2007, the Caremark Merger increased net revenues by
$26.5 billion (net of intersegment eliminations of $3.3 billion),
compared to 2006. As noted previously in this document, 2007
includes net revenues from Caremark from the merger date
(March 22, 2007) forward, compared to 2006, which includes
no net revenues from Caremark.
• On June 2, 2006, we acquired 701 standalone drug stores
and other related assets from Albertson’s, Inc. (the “Albertson’s
Acquisition”). 2007 includes a full year of net revenues from
these stores, compared to 2006, which includes net revenues
from these stores from the acquisition date forward. During
2007, the Albertson’s Acquisition increased net revenues by
$2.2 billion, compared to 2006.
Please see the Segment Analysis later in this document for
additional information about our net revenues.