BT 2015 Annual Report Download - page 9
Download and view the complete annual report
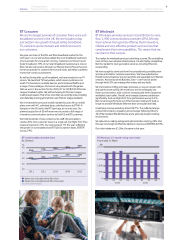
Please find page 9 of the 2015 BT annual report below. You can navigate through the pages in the report by either clicking on the pages listed below, or by using the keyword search tool below to find specific information within the annual report.-
 1
1 -
 2
2 -
 3
3 -
 4
4 -
 5
5 -
 6
6 -
 7
7 -
 8
8 -
 9
9 -
 10
10 -
 11
11 -
 12
12 -
 13
13 -
 14
14 -
 15
15 -
 16
16 -
 17
17 -
 18
18 -
 19
19 -
 20
20 -
21
-
22
-
23
-
24
-
25
-
26
-
27
-
28
-
29
-
30
-
31
-
32
-
33
-
34
-
35
-
36
-
37
-
38
-
39
-
40
-
41
-
42
-
43
-
44
-
45
-
46
-
47
-
48
-
49
-
50
-
51
-
52
-
53
-
54
-
55
-
56
-
57
-
58
-
59
-
60
-
61
-
62
-
63
-
64
-
65
-
66
-
67
-
68
-
69
-
70
-
71
-
72
-
73
-
74
-
75
-
76
-
77
-
78
-
79
-
80
-
81
-
82
-
83
-
84
-
85
-
86
-
87
-
88
-
89
-
90
-
91
-
92
-
93
-
94
-
95
-
96
-
97
-
98
-
99
-
100
-
101
-
102
-
103
-
104
-
105
-
106
-
107
-
108
-
109
-
110
-
111
-
112
-
113
-
114
-
115
-
116
-
117
-
118
-
119
-
120
-
121
-
122
-
123
-
124
-
125
-
126
-
127
-
128
-
129
-
130
-
131
-
132
-
133
-
134
-
135
-
136
-
137
-
138
-
139
-
140
-
141
-
142
-
143
-
144
-
145
-
146
-
147
-
148
-
149
-
150
-
151
-
152
-
153
-
154
-
155
-
156
-
157
-
158
-
159
-
160
-
161
-
162
-
163
-
164
-
165
-
166
-
167
-
168
-
169
-
170
-
171
-
172
-
173
-
174
-
175
-
176
-
177
-
178
-
179
-
180
-
181
-
182
-
183
-
184
-
185
-
186
-
187
-
188
-
189
-
190
-
191
-
192
-
193
-
194
-
195
-
196
-
197
-
198
-
199
-
200
-
201
-
202
-
203
-
204
-
205
-
206
-
207
-
208
-
209
-
210
-
211
-
212
-
213
-
214
-
215
-
216
-
217
-
218
-
219
-
220
-
221
-
222
-
223
-
224
-
225
-
226
-
227
-
228
-
229
-
230
-
231
-
232
-
233
-
234
-
235
-
236
 |
 |

7
Overview
The Strategic Report
Purpose and strategy
Delivering our strategy
0ur lines of business
Group performance
Governance
Financial statements
Additional information
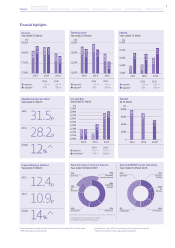
Financial highlights
a,WHPVSUHVHQWHGDVDGMXVWHGDUHVWDWHGEHIRUHVSHFLƬFLWHPV6HHSDJHIRUIXUWKHUGHWDLOV
b Before depreciation and amortisation.
c6HHGHƬQLWLRQRQSDJHDQGVXPPDULVHGFDVKƮRZVWDWHPHQWRQSDJH
d,QFOXGHVWKHLPSDFWRI~EQHTXLW\SODFLQJ6HHSDJH
p
10.9p
p
p
12
^
^
01
01
hane
hane
Adjusted earnings per sharea
ear ended 1 arch
Proposed full year dividend
ear ended 1 arch
2015
2015
Revenue
Year ended 31 March
20142013 2015
17,000
17,500
18,000
18,500
£m
reported 1%
0%
adjusted
a
2%
2%
20152014
18,103
18,339
18,287
18,287
17,979
17,851
Operating costsb
Year ended 31 March
20142013 2015
11,000
11,500
12,000
12,500
£m
reported 1%
0%
adjusted
a
20152014
12,312
12,196
12,447
12,171
11,961
11,580
4%
5%
Free cash ƮRw
Year ended 31 March
20142013 2015
2,000
2,100
2,300
2,500
2,700
2,800
2,600
2,400
2,200
2,900
£m
reported 5% 28%
16%
normalised 7%
2015
2014
2,292
2,300
2,782
2,830
2,171
2,450
c
revenue by line of business
38%
BT Global
Services
11%
Openreach
28%
Openreach
(including internal)
12%
BT
Wholesale
24%
BT Consumer
15%
BT Business
Year ended 31 March 2015
See page 54 for commentary on relative
contributions by each line of business
Adjusted EBITDA by line of business
17%
BT Global
Services
17%
BT
Business
16%
BT Consumer
41%
Openreach
9%
BT Wholesale
Year ended 31 March 2015
Adjusted aa
EBITDA
Year ended 31 March
20142013 2015
5,600
5,800
6,000
6,200
6,400
£m
reported 1% 3%
3%
adjusted
a
0%
20152014
5,791
6,143
5,840
6,116
6,018
6,271
Net debt
At 31 March
20142013 2015
0
2,000
4,000
6,000
8,000
£m
7,797
7,028
5,119
d