BP 2014 Annual Report Download - page 225
Download and view the complete annual report
Please find page 225 of the 2014 BP annual report below. You can navigate through the pages in the report by either clicking on the pages listed below, or by using the keyword search tool below to find specific information within the annual report.-
 1
1 -
2
-
3
-
4
-
5
-
6
-
7
-
8
-
9
-
10
-
11
-
12
-
13
-
14
-
15
-
16
-
17
-
18
-
19
-
20
-
21
-
22
-
23
-
24
-
25
-
26
-
27
-
28
-
29
-
30
-
31
-
32
-
33
-
34
-
35
-
36
-
37
-
38
-
39
-
40
-
41
-
42
-
43
-
44
-
45
-
46
-
47
-
48
-
49
-
50
-
51
-
52
-
53
-
54
-
55
-
56
-
57
-
58
-
59
-
60
-
61
-
62
-
63
-
64
-
65
-
66
-
67
-
68
-
69
-
70
-
71
-
72
-
73
-
74
-
75
-
76
-
77
-
78
-
79
-
80
-
81
-
82
-
83
-
84
-
85
-
86
-
87
-
88
-
89
-
90
-
91
-
92
-
93
-
94
-
95
-
96
-
97
-
98
-
99
-
100
-
101
-
102
-
103
-
104
-
105
-
106
-
107
-
108
-
109
-
110
-
111
-
112
-
113
-
114
-
115
-
116
-
117
-
118
-
119
-
120
-
121
-
122
-
123
-
124
-
125
-
126
-
127
-
128
-
129
-
130
-
131
-
132
-
133
-
134
-
135
-
136
-
137
-
138
-
139
-
140
-
141
-
142
-
143
-
144
-
145
-
146
-
147
-
148
-
149
-
150
-
151
-
152
-
153
-
154
-
155
-
156
-
157
-
158
-
159
-
160
-
161
-
162
-
163
-
164
-
165
-
166
-
167
-
168
-
169
-
170
-
171
-
172
-
173
-
174
-
175
-
176
-
177
-
178
-
179
-
180
-
181
-
182
-
183
-
184
-
185
-
186
-
187
-
188
-
189
-
190
-
191
-
192
-
193
-
194
-
195
-
196
-
197
-
198
-
199
-
200
-
201
-
202
-
203
-
204
-
205
-
206
-
207
-
208
-
209
-
210
-
211
-
212
-
213
-
214
-
 215
215 -
 216
216 -
 217
217 -
 218
218 -
 219
219 -
 220
220 -
 221
221 -
 222
222 -
 223
223 -
 224
224 -
 225
225 -
 226
226 -
 227
227 -
 228
228 -
 229
229 -
 230
230 -
 231
231 -
 232
232 -
 233
233 -
 234
234 -
 235
235 -
236
-
237
-
238
-
239
-
240
-
241
-
242
-
243
-
244
-
245
-
246
-
247
-
248
-
249
-
250
-
251
-
252
-
253
-
254
-
255
-
256
-
257
-
258
-
259
-
260
-
261
-
262
-
263
 |
 |

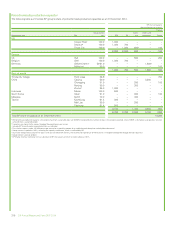
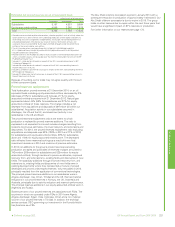
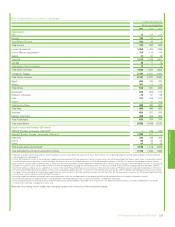
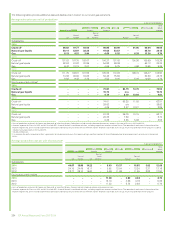
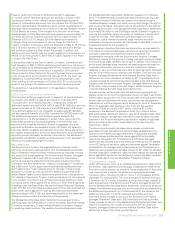
Estimated net proved reserves on an oil equivalent basis
million barrels of oil equivalent
Developed Undeveloped Total
Subsidiaries 5,187 4,507 9,694
Equity-accounted entities 4,548 3,280 7,828
Total 9,735 7,788 17,523
aProved reserves exclude royalties due to others, whether payable in cash or in kind, where the
royalty owner has a direct interest in the underlying production and the option and ability to
make lifting and sales arrangements independently, and include non-controlling interests in
consolidated operations. We disclose our share of reserves held in joint ventures and
associates that are accounted for by the equity method although we do not control these
entities or the assets held by such entities.
bThe 2014 marker prices used were Brent $101.27/bbl (2013 $108.02/bbl and 2012
$111.13/bbl) and Henry Hub $4.31/mmBtu (2013 $3.66/mmBtu and 2012 $2.75/mmBtu).
cIncludes condensate and bitumen.
dProved reserves in the Prudhoe Bay field in Alaska include an estimated 65 million barrels on
which a net profits royalty will be payable over the life of the field under the terms of the BP
Prudhoe Bay Royalty Trust.
eIncludes 21 million barrels of liquids in respect of the 30% non-controlling interest in BP
Trinidad and Tobago LLC.
fIncludes 38 million barrels of crude oil in respect of the 0.16% non-controlling interest in
Rosneft held assets in Russia.
gIncludes 2,519 billion cubic feet of natural gas in respect of the 30% non-controlling interest in
BP Trinidad and Tobago LLC.
hIncludes 91 billion cubic feet of natural gas in respect of the 0.18% non-controlling interest in
Rosneft held assets in Russia.
Because of rounding, some totals may not agree exactly with the sum
of their component parts.
Proved reserves replacement
Total hydrocarbon proved reserves at 31 December 2014, on an oil
equivalent basis including equity-accounted entities, decreased by 3%
(decrease of 5% for subsidiaries and increase of 1% for equity-
accounted entities) compared with 31 December 2013. Natural gas
represented about 44% (58% for subsidiaries and 27% for equity-
accounted entities) of these reserves. The change includes a net
decrease from acquisitions and disposals of 39mmboe (all within our
subsidiaries). Acquisition activity in our subsidiaries occurred in
Azerbaijan, the US and the UK, and divestment activity in our
subsidiaries in the US and Brazil.
The proved reserves replacement ratio is the extent to which
production is replaced by proved reserves additions. This ratio is
expressed in oil equivalent terms and includes changes resulting from
revisions to previous estimates, improved recovery, and extensions and
discoveries. For 2014, the proved reserves replacement ratio excluding
acquisitions and disposals was 63% (129% in 2013 and 77% in 2012)
for subsidiaries and equity-accounted entities, 29% for subsidiaries
alone and 116% for equity-accounted entities alone. The decreased
ratio reflected lower reserves bookings as a result of fewer final
investment decisions in 2014 and revisions of previous estimates.
In 2014 net additions to the group’s proved reserves (excluding
production and sales and purchases of reserves-in-place) amounted to
743mmboe (208mmboe for subsidiaries and 535mmboe for equity-
accounted entities), through revisions to previous estimates, improved
recovery from, and extensions to, existing fields and discoveries of new
fields. The subsidiary additions through improved recovery from, and
extensions to, existing fields and discoveries of new fields were in
existing developments where they represented a mixture of proved
developed and proved undeveloped reserves. Volumes added in 2014
principally resulted from the application of conventional technologies.
The principal proved reserves additions in our subsidiaries were in
Angola, Azerbaijan, Iraq, Oman, Trinidad and the US. We had material
reductions in our proved reserves in Norway, the UK, Indonesia and
Australia, principally due to activity reduction and reservoir performance.
The principal reserves additions in our equity-accounted entities were in
Argentina and Russia.
Sixteen per cent of our proved reserves are associated with PSAs. The
countries in which we operated under PSAs in 2014 were Algeria,
Angola, Azerbaijan, Egypt, India, Indonesia, Oman and a non-material
volume of our proved reserves in Trinidad. In addition, the technical
service contract (TSC) governing our investment in the Rumaila field in
Iraq functions as a PSA.
The Abu Dhabi onshore concession expired in January 2014 with a
consequent reduction in production of approximately 140mboe/d. Our
Abu Dhabi offshore concession is due to expire in 2018. The group
holds no other licences due to expire within the next three years that
would have a significant impact on BP’s reserves or production.
For further information on our reserves see page 174.
Additional disclosures
*Defined on page 252. BP Annual Report and Form 20-F 2014 221