BP 2014 Annual Report Download - page 168
Download and view the complete annual report
Please find page 168 of the 2014 BP annual report below. You can navigate through the pages in the report by either clicking on the pages listed below, or by using the keyword search tool below to find specific information within the annual report.-
 1
1 -
2
-
3
-
4
-
5
-
6
-
7
-
8
-
9
-
10
-
11
-
12
-
13
-
14
-
15
-
16
-
17
-
18
-
19
-
20
-
21
-
22
-
23
-
24
-
25
-
26
-
27
-
28
-
29
-
30
-
31
-
32
-
33
-
34
-
35
-
36
-
37
-
38
-
39
-
40
-
41
-
42
-
43
-
44
-
45
-
46
-
47
-
48
-
49
-
50
-
51
-
52
-
53
-
54
-
55
-
56
-
57
-
58
-
59
-
60
-
61
-
62
-
63
-
64
-
65
-
66
-
67
-
68
-
69
-
70
-
71
-
72
-
73
-
74
-
75
-
76
-
77
-
78
-
79
-
80
-
81
-
82
-
83
-
84
-
85
-
86
-
87
-
88
-
89
-
90
-
91
-
92
-
93
-
94
-
95
-
96
-
97
-
98
-
99
-
100
-
101
-
102
-
103
-
104
-
105
-
106
-
107
-
108
-
109
-
110
-
111
-
112
-
113
-
114
-
115
-
116
-
117
-
118
-
119
-
120
-
121
-
122
-
123
-
124
-
125
-
126
-
127
-
128
-
129
-
130
-
131
-
132
-
133
-
134
-
135
-
136
-
137
-
138
-
139
-
140
-
141
-
142
-
143
-
144
-
145
-
146
-
147
-
148
-
149
-
150
-
151
-
152
-
153
-
154
-
155
-
156
-
157
-
 158
158 -
 159
159 -
 160
160 -
 161
161 -
 162
162 -
 163
163 -
 164
164 -
 165
165 -
 166
166 -
 167
167 -
 168
168 -
 169
169 -
 170
170 -
 171
171 -
 172
172 -
 173
173 -
 174
174 -
 175
175 -
 176
176 -
 177
177 -
 178
178 -
179
-
180
-
181
-
182
-
183
-
184
-
185
-
186
-
187
-
188
-
189
-
190
-
191
-
192
-
193
-
194
-
195
-
196
-
197
-
198
-
199
-
200
-
201
-
202
-
203
-
204
-
205
-
206
-
207
-
208
-
209
-
210
-
211
-
212
-
213
-
214
-
215
-
216
-
217
-
218
-
219
-
220
-
221
-
222
-
223
-
224
-
225
-
226
-
227
-
228
-
229
-
230
-
231
-
232
-
233
-
234
-
235
-
236
-
237
-
238
-
239
-
240
-
241
-
242
-
243
-
244
-
245
-
246
-
247
-
248
-
249
-
250
-
251
-
252
-
253
-
254
-
255
-
256
-
257
-
258
-
259
-
260
-
261
-
262
-
263
 |
 |

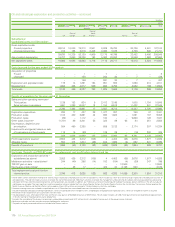
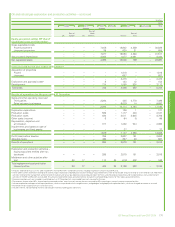
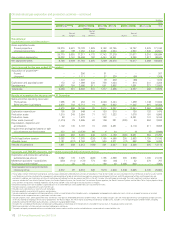
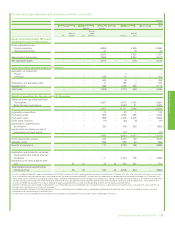
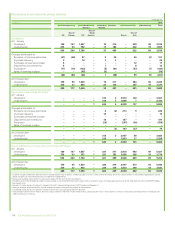
36. Condensed consolidating information on certain US subsidiaries – continued
Balance sheet
$ million
At 31 December 2014
Issuer Guarantor
BP
Exploration
(Alaska) Inc. BP p.l.c.
Other
subsidiaries
Eliminations and
reclassifications BP group
Non-current assets
Property, plant and equipment 7,787 – 122,905 – 130,692
Goodwill – – 11,868 – 11,868
Intangible assets 473 – 20,434 – 20,907
Investments in joint ventures – – 8,753 – 8,753
Investments in associates – 2 10,401 – 10,403
Other investments – – 1,228 – 1,228
Subsidiaries – equity-accounted basis – 138,863 – (138,863) –
Fixed assets 8,260 138,865 175,589 (138,863) 183,851
Loans 7 – 5,238 (4,586) 659
Trade and other receivables – – 4,787 – 4,787
Derivative financial instruments – – 4,442 – 4,442
Prepayments 10 – 954 – 964
Deferred tax assets – – 2,309 – 2,309
Defined benefit pension plan surpluses –15 16 –31
8,277 138,880 193,335 (143,449) 197,043
Current assets
Loans – – 333 – 333
Inventories 338 – 18,035 – 18,373
Trade and other receivables 10,323 7,159 33,463 (19,907) 31,038
Derivative financial instruments – – 5,165 – 5,165
Prepayments 31 – 1,393 – 1,424
Current tax receivable – – 837 – 837
Other investments – – 329 – 329
Cash and cash equivalents – 31 29,732 – 29,763
10,692 7,190 89,287 (19,907) 87,262
Total assets 18,969 146,070 282,622 (163,356) 284,305
Current liabilities
Trade and other payables 905 2,476 56,644 (19,907) 40,118
Derivative financial instruments – – 3,689 – 3,689
Accruals 134 391 6,577 – 7,102
Finance debt – – 6,877 – 6,877
Current tax payable 328 – 1,683 – 2,011
Provisions 1 – 3,817 – 3,818
1,368 2,867 79,287 (19,907) 63,615
Non-current liabilities
Other payables 16 4,563 3,594 (4,586) 3,587
Derivative financial instruments – – 3,199 – 3,199
Accruals – 90 771 – 861
Finance debt – – 45,977 – 45,977
Deferred tax liabilities 1,232 – 12,661 – 13,893
Provisions 1,975 – 27,105 – 29,080
Defined benefit pension plan and other post-retirement benefit plan
deficits – 599 10,852 – 11,451
3,223 5,252 104,159 (4,586) 108,048
Total liabilities 4,591 8,119 183,446 (24,493) 171,663
Net assets 14,378 137,951 99,176 (138,863) 112,642
Equity
BP shareholders’ equity 14,378 137,951 97,975 (138,863) 111,441
Non-controlling interests – – 1,201 – 1,201
14,378 137,951 99,176 (138,863) 112,642
164 BP Annual Report and Form 20-F 2014