BP 2014 Annual Report Download - page 153
Download and view the complete annual report
Please find page 153 of the 2014 BP annual report below. You can navigate through the pages in the report by either clicking on the pages listed below, or by using the keyword search tool below to find specific information within the annual report.-
 1
1 -
2
-
3
-
4
-
5
-
6
-
7
-
8
-
9
-
10
-
11
-
12
-
13
-
14
-
15
-
16
-
17
-
18
-
19
-
20
-
21
-
22
-
23
-
24
-
25
-
26
-
27
-
28
-
29
-
30
-
31
-
32
-
33
-
34
-
35
-
36
-
37
-
38
-
39
-
40
-
41
-
42
-
43
-
44
-
45
-
46
-
47
-
48
-
49
-
50
-
51
-
52
-
53
-
54
-
55
-
56
-
57
-
58
-
59
-
60
-
61
-
62
-
63
-
64
-
65
-
66
-
67
-
68
-
69
-
70
-
71
-
72
-
73
-
74
-
75
-
76
-
77
-
78
-
79
-
80
-
81
-
82
-
83
-
84
-
85
-
86
-
87
-
88
-
89
-
90
-
91
-
92
-
93
-
94
-
95
-
96
-
97
-
98
-
99
-
100
-
101
-
102
-
103
-
104
-
105
-
106
-
107
-
108
-
109
-
110
-
111
-
112
-
113
-
114
-
115
-
116
-
117
-
118
-
119
-
120
-
121
-
122
-
123
-
124
-
125
-
126
-
127
-
128
-
129
-
130
-
131
-
132
-
133
-
134
-
135
-
136
-
137
-
138
-
139
-
140
-
141
-
142
-
 143
143 -
 144
144 -
 145
145 -
 146
146 -
 147
147 -
 148
148 -
 149
149 -
 150
150 -
 151
151 -
 152
152 -
 153
153 -
 154
154 -
 155
155 -
 156
156 -
 157
157 -
 158
158 -
 159
159 -
 160
160 -
 161
161 -
 162
162 -
 163
163 -
164
-
165
-
166
-
167
-
168
-
169
-
170
-
171
-
172
-
173
-
174
-
175
-
176
-
177
-
178
-
179
-
180
-
181
-
182
-
183
-
184
-
185
-
186
-
187
-
188
-
189
-
190
-
191
-
192
-
193
-
194
-
195
-
196
-
197
-
198
-
199
-
200
-
201
-
202
-
203
-
204
-
205
-
206
-
207
-
208
-
209
-
210
-
211
-
212
-
213
-
214
-
215
-
216
-
217
-
218
-
219
-
220
-
221
-
222
-
223
-
224
-
225
-
226
-
227
-
228
-
229
-
230
-
231
-
232
-
233
-
234
-
235
-
236
-
237
-
238
-
239
-
240
-
241
-
242
-
243
-
244
-
245
-
246
-
247
-
248
-
249
-
250
-
251
-
252
-
253
-
254
-
255
-
256
-
257
-
258
-
259
-
260
-
261
-
262
-
263
 |
 |

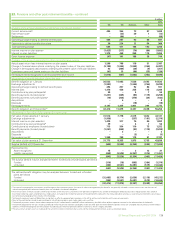
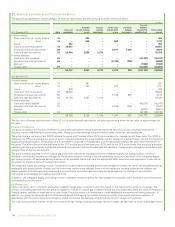
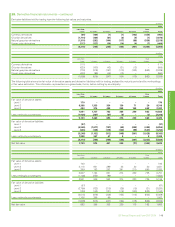
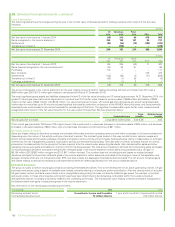
28. Derivative financial instruments – continued
Derivative liabilities held for trading have the following fair values and maturities.
$ million
2014
Less than
1 year 1-2 years 2-3 years 3-4 years 4-5 years
Over
5 years Total
Currency derivatives (69) (180) (1) (1) (192) (459) (902)
Oil price derivatives (1,714) (186) (61) (8) (6) (1) (1,976)
Natural gas price derivatives (1,310) (292) (144) (117) (99) (556) (2,518)
Power price derivatives (217) (127) (39) (10) (4) (7) (404)
(3,310) (785) (245) (136) (301) (1,023) (5,800)
$ million
2013
Less than
1 year 1-2 years 2-3 years 3-4 years 4-5 years
Over
5 years Total
Currency derivatives (111) –––––(111)
Oil price derivatives (620) (100) (42) (31) (13) – (806)
Natural gas price derivatives (778) (319) (157) (110) (102) (563) (2,029)
Power price derivatives (400) (99) (48) (13) – – (560)
(1,909) (518) (247) (154) (115) (563) (3,506)
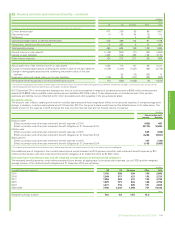
The following table shows the fair value of derivative assets and derivative liabilities held for trading, analysed by maturity period and by methodology
of fair value estimation. This information is presented on a gross basis, that is, before netting by counterparty.
$ million
2014
Less than
1 year 1-2 years 2-3 years 3-4 years 4-5 years
Over
5 years Total
Fair value of derivative assets
Level 1 170–––––170
Level 2 6,388 1,353 354 130 71 20 8,316
Level 3 483 374 409 255 159 642 2,322
7,041 1,727 763 385 230 662 10,808
Less: netting by counterparty (1,938) (367) (67) (9) – (2) (2,383)
5,103 1,360 696 376 230 660 8,425
Fair value of derivative liabilities
Level 1 (37) –––––(37)
Level 2 (4,905) (1,017) (197) (45) (202) (488) (6,854)
Level 3 (306) (135) (115) (100) (99) (537) (1,292)
(5,248) (1,152) (312) (145) (301) (1,025) (8,183)
Less: netting by counterparty 1,938 367 67 9 – 2 2,383
(3,310) (785) (245) (136) (301) (1,023) (5,800)
Net fair value 1,793 575 451 240 (71) (363) 2,625
$ million
2013
Less than
1 year 1-2 years 2-3 years 3-4 years 4-5 years
Over
5 years Total
Fair value of derivative assets
Level 1 100 –––––100
Level 2 3,118 981 399 83 20 30 4,631
Level 3 389 183 252 291 210 695 2,020
3,607 1,164 651 374 230 725 6,751
Less: netting by counterparty (1,106) (358) (99) – – – (1,563)
2,501 806 552 374 230 725 5,188
Fair value of derivative liabilities
Level 1 (87) –––––(87)
Level 2 (2,790) (733) (215) (36) (15) (31) (3,820)
Level 3 (138) (143) (131) (118) (100) (532) (1,162)
(3,015) (876) (346) (154) (115) (563) (5,069)
Less: netting by counterparty 1,106 358 99 – – – 1,563
(1,909) (518) (247) (154) (115) (563) (3,506)
Net fair value 592 288 305 220 115 162 1,682
Financial statements
BP Annual Report and Form 20-F 2014 149