BP 2014 Annual Report Download - page 188
Download and view the complete annual report
Please find page 188 of the 2014 BP annual report below. You can navigate through the pages in the report by either clicking on the pages listed below, or by using the keyword search tool below to find specific information within the annual report.-
 1
1 -
2
-
3
-
4
-
5
-
6
-
7
-
8
-
9
-
10
-
11
-
12
-
13
-
14
-
15
-
16
-
17
-
18
-
19
-
20
-
21
-
22
-
23
-
24
-
25
-
26
-
27
-
28
-
29
-
30
-
31
-
32
-
33
-
34
-
35
-
36
-
37
-
38
-
39
-
40
-
41
-
42
-
43
-
44
-
45
-
46
-
47
-
48
-
49
-
50
-
51
-
52
-
53
-
54
-
55
-
56
-
57
-
58
-
59
-
60
-
61
-
62
-
63
-
64
-
65
-
66
-
67
-
68
-
69
-
70
-
71
-
72
-
73
-
74
-
75
-
76
-
77
-
78
-
79
-
80
-
81
-
82
-
83
-
84
-
85
-
86
-
87
-
88
-
89
-
90
-
91
-
92
-
93
-
94
-
95
-
96
-
97
-
98
-
99
-
100
-
101
-
102
-
103
-
104
-
105
-
106
-
107
-
108
-
109
-
110
-
111
-
112
-
113
-
114
-
115
-
116
-
117
-
118
-
119
-
120
-
121
-
122
-
123
-
124
-
125
-
126
-
127
-
128
-
129
-
130
-
131
-
132
-
133
-
134
-
135
-
136
-
137
-
138
-
139
-
140
-
141
-
142
-
143
-
144
-
145
-
146
-
147
-
148
-
149
-
150
-
151
-
152
-
153
-
154
-
155
-
156
-
157
-
158
-
159
-
160
-
161
-
162
-
163
-
164
-
165
-
166
-
167
-
168
-
169
-
170
-
171
-
172
-
173
-
174
-
175
-
176
-
177
-
 178
178 -
 179
179 -
 180
180 -
 181
181 -
 182
182 -
 183
183 -
 184
184 -
 185
185 -
 186
186 -
 187
187 -
 188
188 -
 189
189 -
 190
190 -
 191
191 -
 192
192 -
 193
193 -
 194
194 -
 195
195 -
 196
196 -
 197
197 -
 198
198 -
199
-
200
-
201
-
202
-
203
-
204
-
205
-
206
-
207
-
208
-
209
-
210
-
211
-
212
-
213
-
214
-
215
-
216
-
217
-
218
-
219
-
220
-
221
-
222
-
223
-
224
-
225
-
226
-
227
-
228
-
229
-
230
-
231
-
232
-
233
-
234
-
235
-
236
-
237
-
238
-
239
-
240
-
241
-
242
-
243
-
244
-
245
-
246
-
247
-
248
-
249
-
250
-
251
-
252
-
253
-
254
-
255
-
256
-
257
-
258
-
259
-
260
-
261
-
262
-
263
 |
 |

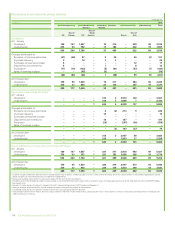
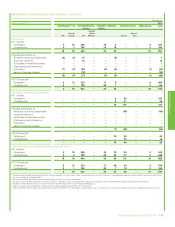
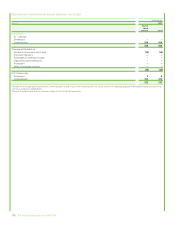
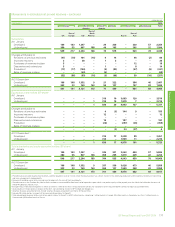
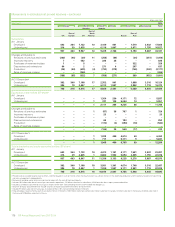
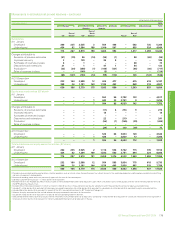
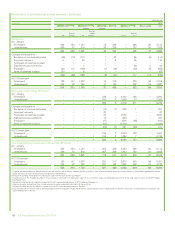
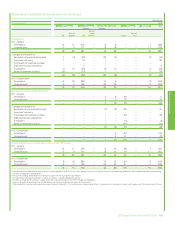
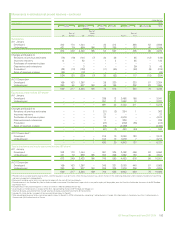
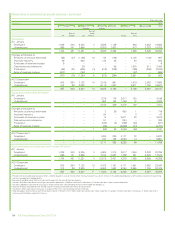
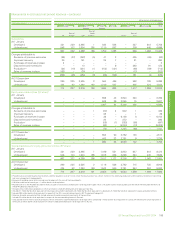
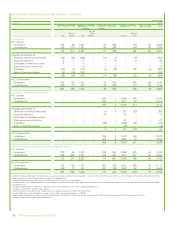
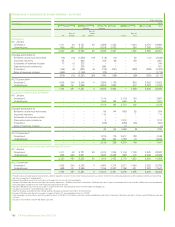
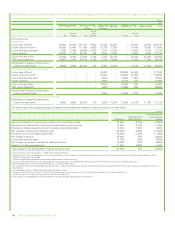
Movements in estimated net proved reserves – continued
billion cubic feet
Natural gasab 2013
Europe North
America
South
America
Africa Asia Australasia Total
UK
Rest of
Europe US
Rest of
North
America Russia
Rest of
Asia
Subsidiaries
At 1 January
Developed 1,038 340 8,245 4 3,588 1,139 – 926 3,282 18,562
Undeveloped 666 141 2,986 – 6,250 1,923 – 413 2,323 14,702
1,704 481 11,231 4 9,838 3,062 – 1,339 5,605 33,264
Changes attributable to
Revisions of previous estimates (62) (47) (1,166) 10 62 (138) – 2,148 (140) 667
Improved recovery 49 – 630 – 144 28 – 94 – 945
Purchases of reserves-in-place 9 – – – –––– – 9
Discoveries and extensions – – 39 – – 55 – 1,875 511 2,480
Productionc(66) (31) (635) (4) (819) (239) – (199) (289) (2,282)
Sales of reserves-in-place (677) – (152) – – – – (67) – (896)
(747) (78) (1,284) 6 (613) (294) – 3,851 82 923
At 31 Decemberd
Developed 643 364 7,122 10 3,109 961 – 1,519 3,932 17,660
Undeveloped 314 39 2,825 – 6,116 1,807 – 3,671 1,755 16,527
957 403 9,947 10 9,225 2,768 – 5,190 5,687 34,187
Equity-accounted entities (BP share)e
At 1 January
Developed – – – – 1,276 175 2,617 128 – 4,196
Undeveloped – – – – 904 164 1,759 18 – 2,845
– – – – 2,180 339 4,376 146 – 7,041
Changes attributable to
Revisions of previous estimates – – – 1 3 29 685 1 – 719
Improved recovery – – – – 64 – – 3 – 67
Purchases of reserves-in-place – – – – 14 – 8,871 33 – 8,918
Discoveries and extensions – – – – 51 – 254 – – 305
Productionc– – – – (163) (3) (292) (23) – (481)
Sales of reserves-in-place – – – – (38) – (4,669) (74) – (4,781)
– – – 1 (69) 26 4,849 (60) – 4,747
At 31 Decemberfg
Developed – – – – 1,364 230 4,171 72 – 5,837
Undeveloped – – – 1 747 135 5,054 14 – 5,951
– – – 1 2,111 365 9,225 86 – 11,788
Total subsidiaries and equity-accounted entities (BP share)
At 1 January
Developed 1,038 340 8,245 4 4,864 1,314 2,617 1,054 3,282 22,758
Undeveloped 666 141 2,986 – 7,154 2,087 1,759 431 2,323 17,547
1,704 481 11,231 4 12,018 3,401 4,376 1,485 5,605 40,305
At 31 December
Developed 643 364 7,122 10 4,473 1,191 4,171 1,591 3,932 23,497
Undeveloped 314 39 2,825 1 6,863 1,942 5,054 3,685 1,755 22,478
957 403 9,947 11 11,336 3,133 9,225 5,276 5,687 45,975
aProved reserves exclude royalties due to others, whether payable in cash or in kind, where the royalty owner has a direct interest in the underlying production and the option and ability to make lifting
and sales arrangements independently.
bBecause of rounding, some totals may not exactly agree with the sum of their counterparts.
cIncludes 180 billion cubic feet of natural gas consumed in operations, 149 billion cubic feet in subsidiaries, 31 billion cubic feet in equity-accounted entities.
dIncludes 2,685 billion cubic feet of natural gas in respect of the 30% non-controlling interest in BP Trinidad and Tobago LLC.
eVolumes of equity-accounted entities include volumes of equity-accounted investments of those entities.
fIncludes 41 billion cubic feet of natural gas in respect of the 0.44% non-controlling interest in Rosneft.
gTotal proved gas reserves held as part of our equity interest in Rosneft is 9,271 billion cubic feet, comprising 1 billion cubic feet in Canada, 14 billion cubic feet in Venezuela, 31 billion cubic feet in
Vietnam and 9,225 billion cubic feet in Russia.
184 BP Annual Report and Form 20-F 2014