BP 2014 Annual Report Download - page 212
Download and view the complete annual report
Please find page 212 of the 2014 BP annual report below. You can navigate through the pages in the report by either clicking on the pages listed below, or by using the keyword search tool below to find specific information within the annual report.-
 1
1 -
2
-
3
-
4
-
5
-
6
-
7
-
8
-
9
-
10
-
11
-
12
-
13
-
14
-
15
-
16
-
17
-
18
-
19
-
20
-
21
-
22
-
23
-
24
-
25
-
26
-
27
-
28
-
29
-
30
-
31
-
32
-
33
-
34
-
35
-
36
-
37
-
38
-
39
-
40
-
41
-
42
-
43
-
44
-
45
-
46
-
47
-
48
-
49
-
50
-
51
-
52
-
53
-
54
-
55
-
56
-
57
-
58
-
59
-
60
-
61
-
62
-
63
-
64
-
65
-
66
-
67
-
68
-
69
-
70
-
71
-
72
-
73
-
74
-
75
-
76
-
77
-
78
-
79
-
80
-
81
-
82
-
83
-
84
-
85
-
86
-
87
-
88
-
89
-
90
-
91
-
92
-
93
-
94
-
95
-
96
-
97
-
98
-
99
-
100
-
101
-
102
-
103
-
104
-
105
-
106
-
107
-
108
-
109
-
110
-
111
-
112
-
113
-
114
-
115
-
116
-
117
-
118
-
119
-
120
-
121
-
122
-
123
-
124
-
125
-
126
-
127
-
128
-
129
-
130
-
131
-
132
-
133
-
134
-
135
-
136
-
137
-
138
-
139
-
140
-
141
-
142
-
143
-
144
-
145
-
146
-
147
-
148
-
149
-
150
-
151
-
152
-
153
-
154
-
155
-
156
-
157
-
158
-
159
-
160
-
161
-
162
-
163
-
164
-
165
-
166
-
167
-
168
-
169
-
170
-
171
-
172
-
173
-
174
-
175
-
176
-
177
-
178
-
179
-
180
-
181
-
182
-
183
-
184
-
185
-
186
-
187
-
188
-
189
-
190
-
191
-
192
-
193
-
194
-
195
-
196
-
197
-
198
-
199
-
200
-
201
-
 202
202 -
 203
203 -
 204
204 -
 205
205 -
 206
206 -
 207
207 -
 208
208 -
 209
209 -
 210
210 -
 211
211 -
 212
212 -
 213
213 -
 214
214 -
 215
215 -
 216
216 -
 217
217 -
 218
218 -
 219
219 -
 220
220 -
 221
221 -
 222
222 -
223
-
224
-
225
-
226
-
227
-
228
-
229
-
230
-
231
-
232
-
233
-
234
-
235
-
236
-
237
-
238
-
239
-
240
-
241
-
242
-
243
-
244
-
245
-
246
-
247
-
248
-
249
-
250
-
251
-
252
-
253
-
254
-
255
-
256
-
257
-
258
-
259
-
260
-
261
-
262
-
263
 |
 |

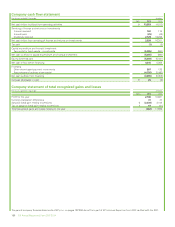
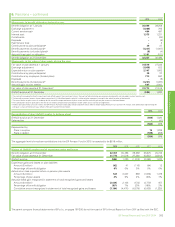
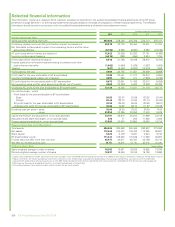
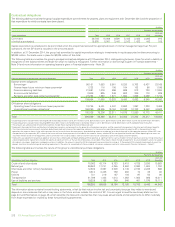
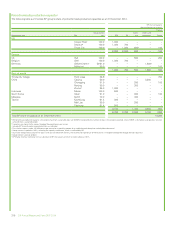
Selected financial information
This information, insofar as it relates to 2014, has been extracted or derived from the audited consolidated financial statements of the BP group
presented on page 89. Note 1 to the financial statements includes details on the basis of preparation of these financial statements. The selected
information should be read in conjunction with the audited financial statements and related notes elsewhere herein.
$ million except per share amounts
2014 2013 2012 2011 2010
Income statement data
Sales and other operating revenues 353,568 379,136 375,765 375,713 297,107
Underlying replacement cost (RC) profit before interest and taxation*20,818 22,776 26,454 33,601 31,704
Net favourable (unfavourable) impact of non-operating items*and fair value
accounting effects*(8,196) 9,283 (6,091) 3,580 (37,190)
RC profit (loss) before interest and taxation*12,622 32,059 20,363 37,181 (5,486)
Inventory holding gains (losses)*(6,210) (290) (594) 2,634 1,784
Profit (loss) before interest and taxation 6,412 31,769 19,769 39,815 (3,702)
Finance costs and net finance expense relating to pensions and other
post-retirement benefits (1,462) (1,548) (1,638) (1,587) (1,605)
Taxation (947) (6,463) (6,880) (12,619) 1,638
Profit (loss) for the year 4,003 23,758 11,251 25,609 (3,669)
Profit (loss) for the year attributable to BP shareholders 3,780 23,451 11,017 25,212 (4,064)
Inventory holding (gains) losses, net of taxation 4,293 230 411 (1,800) (1,195)
RC profit (loss) for the year attributable to BP shareholders 8,073 23,681 11,428 23,412 (5,259)
Non-operating items and fair value accounting effects, net of taxation 4,063 (10,253) 5,643 (2,242) 25,436
Underlying RC profit for the year attributable to BP shareholders 12,136 13,428 17,071 21,170 20,177
Per ordinary share – cents
Profit (loss) for the year attributable to BP shareholders
Basic 20.55 123.87 57.89 133.35 (21.64)
Diluted 20.42 123.12 57.50 131.74 (21.64)
RC profit (loss) for the year attributable to BP shareholders 43.90 125.08 60.05 123.83 (28.01)
Underlying RC profit for the year attributable to BP shareholders 66.00 70.92 89.70 111.97 107.39
Dividends paid per share – cents 39.00 36.50 33.00 28.00 14.00
– pence 23.850 23.399 20.852 17.404 8.679
Capital expenditure and acquisitions, on an accruals basis 23,781 36,612 25,204 31,959 23,016
Acquisitions and asset exchanges, on an accruals basis 420 71 200 11,283 3,406
Organic capital expenditure*a, on an accruals basis 22,892 24,600 23,950 19,580 18,218
Balance sheet data (at 31 December)
Total assets 284,305 305,690 300,466 292,907 272,262
Net assets 112,642 130,407 119,752 112,585 95,891
Share capital 5,023 5,129 5,261 5,224 5,183
BP shareholders’ equity 111,441 129,302 118,546 111,568 94,987
Finance debt due after more than one year 45,977 40,811 38,767 35,169 30,710
Net debt to net debt plus equity*16.7% 16.2% 18.7% 20.4% 21.2%
Ordinary share databShares million
Basic weighted average number of shares 18,385 18,931 19,028 18,905 18,786
Diluted weighted average number of shares 18,497 19,046 19,158 19,136 18,998
aOrganic capital expenditure excludes acquisitions and asset exchanges, and: in 2014 $469 million relating to the purchase of an additional 3.3% equity in Shah Deniz, Azerbaijan and the South Caucasus
Pipeline; in 2013 $11,941 million relating to our investment in Rosneft; in 2012 $1,054 million associated with deepening our US natural gas and North Sea asset bases; in 2011 $1,096 million
associated with deepening our US natural gas bases; in 2010 $900 million relating to the formation of a partnership with Value Creation Inc. to develop the Terre de Grace oil sands acreage and
$492 million for the purchase of additional interests in the Valhall and Hod fields in the North Sea.
bThe number of ordinary shares shown has been used to calculate the per share amounts.
208 BP Annual Report and Form 20-F 2014