BP 2014 Annual Report Download - page 170
Download and view the complete annual report
Please find page 170 of the 2014 BP annual report below. You can navigate through the pages in the report by either clicking on the pages listed below, or by using the keyword search tool below to find specific information within the annual report.-
 1
1 -
2
-
3
-
4
-
5
-
6
-
7
-
8
-
9
-
10
-
11
-
12
-
13
-
14
-
15
-
16
-
17
-
18
-
19
-
20
-
21
-
22
-
23
-
24
-
25
-
26
-
27
-
28
-
29
-
30
-
31
-
32
-
33
-
34
-
35
-
36
-
37
-
38
-
39
-
40
-
41
-
42
-
43
-
44
-
45
-
46
-
47
-
48
-
49
-
50
-
51
-
52
-
53
-
54
-
55
-
56
-
57
-
58
-
59
-
60
-
61
-
62
-
63
-
64
-
65
-
66
-
67
-
68
-
69
-
70
-
71
-
72
-
73
-
74
-
75
-
76
-
77
-
78
-
79
-
80
-
81
-
82
-
83
-
84
-
85
-
86
-
87
-
88
-
89
-
90
-
91
-
92
-
93
-
94
-
95
-
96
-
97
-
98
-
99
-
100
-
101
-
102
-
103
-
104
-
105
-
106
-
107
-
108
-
109
-
110
-
111
-
112
-
113
-
114
-
115
-
116
-
117
-
118
-
119
-
120
-
121
-
122
-
123
-
124
-
125
-
126
-
127
-
128
-
129
-
130
-
131
-
132
-
133
-
134
-
135
-
136
-
137
-
138
-
139
-
140
-
141
-
142
-
143
-
144
-
145
-
146
-
147
-
148
-
149
-
150
-
151
-
152
-
153
-
154
-
155
-
156
-
157
-
158
-
159
-
 160
160 -
 161
161 -
 162
162 -
 163
163 -
 164
164 -
 165
165 -
 166
166 -
 167
167 -
 168
168 -
 169
169 -
 170
170 -
 171
171 -
 172
172 -
 173
173 -
 174
174 -
 175
175 -
 176
176 -
 177
177 -
 178
178 -
 179
179 -
 180
180 -
181
-
182
-
183
-
184
-
185
-
186
-
187
-
188
-
189
-
190
-
191
-
192
-
193
-
194
-
195
-
196
-
197
-
198
-
199
-
200
-
201
-
202
-
203
-
204
-
205
-
206
-
207
-
208
-
209
-
210
-
211
-
212
-
213
-
214
-
215
-
216
-
217
-
218
-
219
-
220
-
221
-
222
-
223
-
224
-
225
-
226
-
227
-
228
-
229
-
230
-
231
-
232
-
233
-
234
-
235
-
236
-
237
-
238
-
239
-
240
-
241
-
242
-
243
-
244
-
245
-
246
-
247
-
248
-
249
-
250
-
251
-
252
-
253
-
254
-
255
-
256
-
257
-
258
-
259
-
260
-
261
-
262
-
263
 |
 |

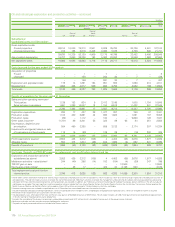
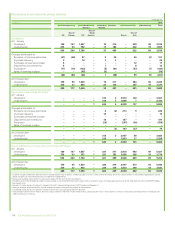
36. Condensed consolidating information on certain US subsidiaries – continued
Cash flow statement
$ million
For the year ended 31 December 2014
Issuer Guarantor
BP
Exploration
(Alaska) Inc. BP p.l.c.
Other
subsidiaries
Eliminations and
reclassifications BP group
Net cash provided by operating activities 92 15,550 19,241 (2,129) 32,754
Net cash used in investing activities (92) (5,085) (14,397) – (19,574)
Net cash used in financing activities – (10,440) 3,045 2,129 (5,266)
Currency translation differences relating to cash and cash equivalents – – (671) – (671)
Increase in cash and cash equivalents – 25 7,218 – 7,243
Cash and cash equivalents at beginning of year – 6 22,514 – 22,520
Cash and cash equivalents at end of year – 31 29,732 – 29,763
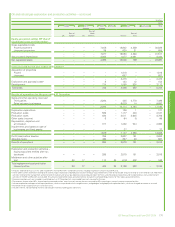
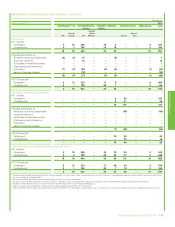
$ million
For the year ended 31 December 2013
Issuer Guarantor
BP
Exploration
(Alaska) Inc. BP p.l.c.
Other
subsidiaries
Eliminations and
reclassifications BP group
Net cash provided by operating activities 746 11,488 25,094 (16,228) 21,100
Net cash used in investing activities (746) (690) (6,419) – (7,855)
Net cash used in financing activities – (10,801) (15,827) 16,228 (10,400)
Currency translation differences relating to cash and cash equivalents – – 40 – 40
Increase (decrease) in cash and cash equivalents – (3) 2,888 – 2,885
Cash and cash equivalents at beginning of year – 9 19,626 – 19,635
Cash and cash equivalents at end of year – 6 22,514 – 22,520
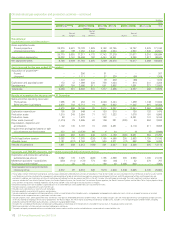
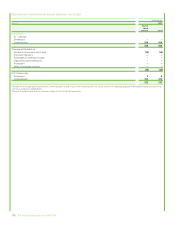
$ million
For the year ended 31 December 2012
Issuer Guarantor
BP
Exploration
(Alaska) Inc. BP p.l.c.
Other
subsidiaries
Eliminations and
reclassifications BP group
Net cash provided by operating activities 681 12,381 20,932 (13,515) 20,479
Net cash used in investing activities (680) (7,060) (5,335) – (13,075)
Net cash used in financing activities – (5,312) (10,213) 13,515 (2,010)
Currency translation differences relating to cash and cash equivalents – – 64 – 64
Increase in cash and cash equivalents 1 9 5,448 – 5,458
Cash and cash equivalents at beginning of year (1) – 14,178 – 14,177
Cash and cash equivalents at end of year – 9 19,626 – 19,635
166 BP Annual Report and Form 20-F 2014