BP 2014 Annual Report Download - page 195
Download and view the complete annual report
Please find page 195 of the 2014 BP annual report below. You can navigate through the pages in the report by either clicking on the pages listed below, or by using the keyword search tool below to find specific information within the annual report.-
 1
1 -
2
-
3
-
4
-
5
-
6
-
7
-
8
-
9
-
10
-
11
-
12
-
13
-
14
-
15
-
16
-
17
-
18
-
19
-
20
-
21
-
22
-
23
-
24
-
25
-
26
-
27
-
28
-
29
-
30
-
31
-
32
-
33
-
34
-
35
-
36
-
37
-
38
-
39
-
40
-
41
-
42
-
43
-
44
-
45
-
46
-
47
-
48
-
49
-
50
-
51
-
52
-
53
-
54
-
55
-
56
-
57
-
58
-
59
-
60
-
61
-
62
-
63
-
64
-
65
-
66
-
67
-
68
-
69
-
70
-
71
-
72
-
73
-
74
-
75
-
76
-
77
-
78
-
79
-
80
-
81
-
82
-
83
-
84
-
85
-
86
-
87
-
88
-
89
-
90
-
91
-
92
-
93
-
94
-
95
-
96
-
97
-
98
-
99
-
100
-
101
-
102
-
103
-
104
-
105
-
106
-
107
-
108
-
109
-
110
-
111
-
112
-
113
-
114
-
115
-
116
-
117
-
118
-
119
-
120
-
121
-
122
-
123
-
124
-
125
-
126
-
127
-
128
-
129
-
130
-
131
-
132
-
133
-
134
-
135
-
136
-
137
-
138
-
139
-
140
-
141
-
142
-
143
-
144
-
145
-
146
-
147
-
148
-
149
-
150
-
151
-
152
-
153
-
154
-
155
-
156
-
157
-
158
-
159
-
160
-
161
-
162
-
163
-
164
-
165
-
166
-
167
-
168
-
169
-
170
-
171
-
172
-
173
-
174
-
175
-
176
-
177
-
178
-
179
-
180
-
181
-
182
-
183
-
184
-
 185
185 -
 186
186 -
 187
187 -
 188
188 -
 189
189 -
 190
190 -
 191
191 -
 192
192 -
 193
193 -
 194
194 -
 195
195 -
 196
196 -
 197
197 -
 198
198 -
 199
199 -
 200
200 -
 201
201 -
 202
202 -
 203
203 -
 204
204 -
 205
205 -
206
-
207
-
208
-
209
-
210
-
211
-
212
-
213
-
214
-
215
-
216
-
217
-
218
-
219
-
220
-
221
-
222
-
223
-
224
-
225
-
226
-
227
-
228
-
229
-
230
-
231
-
232
-
233
-
234
-
235
-
236
-
237
-
238
-
239
-
240
-
241
-
242
-
243
-
244
-
245
-
246
-
247
-
248
-
249
-
250
-
251
-
252
-
253
-
254
-
255
-
256
-
257
-
258
-
259
-
260
-
261
-
262
-
263
 |
 |

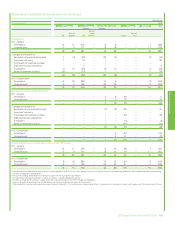
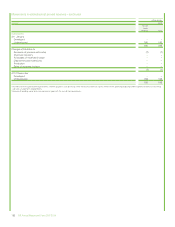
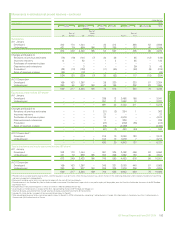
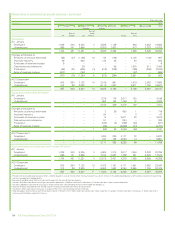
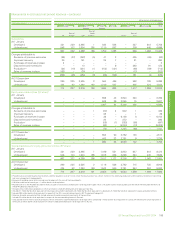
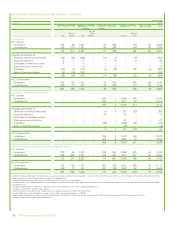
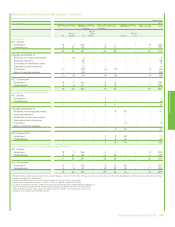
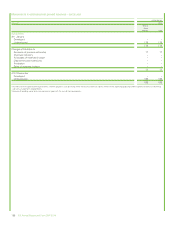
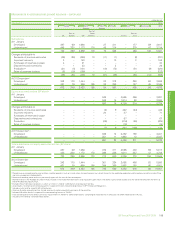
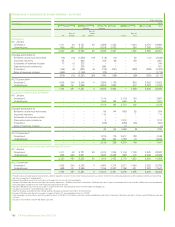
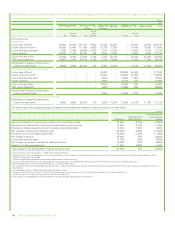
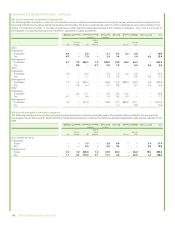
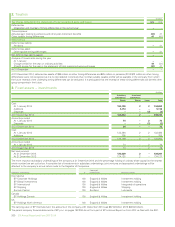
Movements in estimated net proved reserves – continued
million barrels of oil equivalentc
Total hydrocarbonsab 2012
Europe North
America
South
America
Africa Asia Australasia
Total
UK
Rest of
Europe USd
Rest of
North
America Russia
Rest of
Asia
Subsidiaries
At 1 January
Developed 531 76 3,362 5 522 522 – 355 675 6,048
Undeveloped 602 308 1,833 178 1,173 665 – 342 455 5,556
1,133 384 5,195 183 1,695 1,187 – 697 1,130 11,604
Changes attributable to
Revisions of previous estimates (33) (27) (600) 14 (31) (3) – 5 (8) (683)
Improved recovery 19 – 293 – 130 25 – 29 – 496
Purchases of reserves-in-place 7 – 61 – –––– –68
Discoveries and extensions – 2 62 – 103 2 – – – 169
Productionef (59) (9) (256) (1) (143) (116) – (95) (59) (738)
Sales of reserves-in-place (100) (18) (386) – (4) – – – – (508)
(166) (52) (826) 13 55 (92) – (61) (67) (1,196)
At 31 Decembergh
Developed 421 229 2,865 1 640 508 – 427 618 5,709
Undeveloped 546 103 1,504 195 1,110 587 – 209 445 4,699
967 332 4,369 196 1,750 1,095 – 636 1,063 10,408
Equity-accounted entities (BP share)i
At 1 January
Developed – – – – 546 – 2,961 274 – 3,781
Undeveloped – – – – 522 48 1,727 66 – 2,363
– – – – 1,068 48 4,688 340 – 6,144
Changes attributable to
Revisions of previous estimates – – – – 13 34 560 (19) – 588
Improved recovery – – – – 43 – 47 – – 90
Purchases of reserves-in-place – – – – –––– – –
Discoveries and extensions – – – – 1 – 292 – – 293
Productionef – – – – (58) – (364) (86) – (508)
Sales of reserves-in-place – – – – – – (15) – – (15)
– – – – (1) 34 520 (105) – 448
At 31 Decemberjkl
Developed – – – – 559 43 2,943 220 – 3,765
Undeveloped – – – – 508 39 2,265 15 – 2,827
– – – – 1,067 82 5,208 235 – 6,592
Total subsidiaries and equity-accounted entities (BP share)
At 1 January
Developed 531 76 3,362 5 1,068 522 2,961 629 675 9,829
Undeveloped 602 308 1,833 178 1,695 713 1,727 408 455 7,919
1,133 384 5,195 183 2,763 1,235 4,688 1,037 1,130 17,748
At 31 December
Developed 421 229 2,865 1 1,199 551 2,943 647 618 9,474
Undeveloped 546 103 1,504 195 1,618 626 2,265 224 445 7,526
967 332 4,369 196 2,817 1,177 5,208 871 1,063 17,000
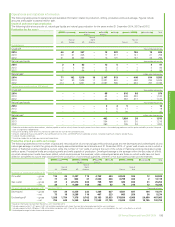
aProved reserves exclude royalties due to others, whether payable in cash or in kind, where the royalty owner has a direct interest in the underlying production and the option and ability to make lifting
and sales arrangements independently.
bBecause of rounding, some totals may not exactly agree with the sum of their counterparts.
c5.8 billion cubic feet of natural gas = 1 million barrels of oil equivalent.
dProved reserves in the Prudhoe Bay field in Alaska include an estimated 76 million barrels of oil equivalent upon which a net profits royalty will be payable, over the life of the field under the terms of
the BP Prudhoe Bay Royalty Trust.
eExcludes NGLs from processing plants in which an interest is held of 13,500 barrels of oil equivalent per day.
fIncludes 33 million barrels of oil equivalent of natural gas consumed in operations, 25 million barrels of oil equivalent in subsidiaries, 8 million barrels of oil equivalent in equity-accounted entities and
excludes 2 million barrels of oil equivalent of produced non-hydrocarbon components that meet regulatory requirements for sales.
gIncludes 591 million barrels of NGLs. Also includes 512 million barrels of oil equivalent in respect of the 30% non-controlling interest in BP Trinidad and Tobago LLC.
hIncludes assets held for sale of 140 million barrels of oil equivalent.
iVolumes of equity-accounted entities include volumes of equity-accounted investments of those entities.
jIncludes 103 million barrels of NGLs. Also includes 374 million barrels of oil equivalent in respect of the non-controlling interest in TNK-BP.
kTotal proved reserves held as part of our equity interest in TNK-BP is 5,315 million barrels of oil equivalent, comprising 93 million barrels of oil equivalent in Venezuela, 14 million barrels of oil equivalent
in Vietnam and 5,208 million barrels of oil equivalent in Russia.
lIncludes assets held for sale of 5,315 million barrels of oil equivalent.
Financial statements
BP Annual Report and Form 20-F 2014 191