BP 2014 Annual Report Download - page 126
Download and view the complete annual report
Please find page 126 of the 2014 BP annual report below. You can navigate through the pages in the report by either clicking on the pages listed below, or by using the keyword search tool below to find specific information within the annual report.-
 1
1 -
2
-
3
-
4
-
5
-
6
-
7
-
8
-
9
-
10
-
11
-
12
-
13
-
14
-
15
-
16
-
17
-
18
-
19
-
20
-
21
-
22
-
23
-
24
-
25
-
26
-
27
-
28
-
29
-
30
-
31
-
32
-
33
-
34
-
35
-
36
-
37
-
38
-
39
-
40
-
41
-
42
-
43
-
44
-
45
-
46
-
47
-
48
-
49
-
50
-
51
-
52
-
53
-
54
-
55
-
56
-
57
-
58
-
59
-
60
-
61
-
62
-
63
-
64
-
65
-
66
-
67
-
68
-
69
-
70
-
71
-
72
-
73
-
74
-
75
-
76
-
77
-
78
-
79
-
80
-
81
-
82
-
83
-
84
-
85
-
86
-
87
-
88
-
89
-
90
-
91
-
92
-
93
-
94
-
95
-
96
-
97
-
98
-
99
-
100
-
101
-
102
-
103
-
104
-
105
-
106
-
107
-
108
-
109
-
110
-
111
-
112
-
113
-
114
-
115
-
 116
116 -
 117
117 -
 118
118 -
 119
119 -
 120
120 -
 121
121 -
 122
122 -
 123
123 -
 124
124 -
 125
125 -
 126
126 -
 127
127 -
 128
128 -
 129
129 -
 130
130 -
 131
131 -
 132
132 -
 133
133 -
 134
134 -
 135
135 -
 136
136 -
137
-
138
-
139
-
140
-
141
-
142
-
143
-
144
-
145
-
146
-
147
-
148
-
149
-
150
-
151
-
152
-
153
-
154
-
155
-
156
-
157
-
158
-
159
-
160
-
161
-
162
-
163
-
164
-
165
-
166
-
167
-
168
-
169
-
170
-
171
-
172
-
173
-
174
-
175
-
176
-
177
-
178
-
179
-
180
-
181
-
182
-
183
-
184
-
185
-
186
-
187
-
188
-
189
-
190
-
191
-
192
-
193
-
194
-
195
-
196
-
197
-
198
-
199
-
200
-
201
-
202
-
203
-
204
-
205
-
206
-
207
-
208
-
209
-
210
-
211
-
212
-
213
-
214
-
215
-
216
-
217
-
218
-
219
-
220
-
221
-
222
-
223
-
224
-
225
-
226
-
227
-
228
-
229
-
230
-
231
-
232
-
233
-
234
-
235
-
236
-
237
-
238
-
239
-
240
-
241
-
242
-
243
-
244
-
245
-
246
-
247
-
248
-
249
-
250
-
251
-
252
-
253
-
254
-
255
-
256
-
257
-
258
-
259
-
260
-
261
-
262
-
263
 |
 |

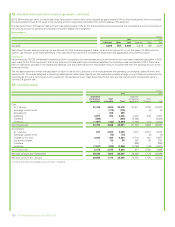
4. Segmental analysis – continued
$ million
2012
By business Upstream Downstream TNK-BP
Other
businesses
and
corporate
Gulf of
Mexico
oil spill
response
Consolidation
adjustment
and
eliminations
Total
group
Segment revenues
Sales and other operating revenues 72,225 346,391 – 1,985 – (44,836) 375,765
Less: sales and other operating revenues between
segments (42,572) (1,365) – (899) – 44,836 –
Third party sales and other operating revenues 29,653 345,026 – 1,086 – – 375,765
Equity-accounted earnings 915 101 2,986 (67) – – 3,935
Segment results
Replacement cost profit (loss) before interest and taxation 22,491 2,864 3,373 (2,794) (4,995) (576) 20,363
Inventory holding gains (losses)a(104) (487) (3) – – – (594)
Profit (loss) before interest and taxation 22,387 2,377 3,370 (2,794) (4,995) (576) 19,769
Finance costs (1,072)
Net finance expense relating to pensions and other post-
retirement benefits (566)
Profit before taxation 18,131
Other income statement items
Depreciation, depletion and amortizationb
US 3,437 586 – 213 – – 4,236
Non-US 6,918 1,343 – 190 – – 8,451
Fair value (gain) loss on embedded derivatives (347) – – – – – (347)
Charges for provisions, net of write-back of unused
provisions, including change in discount rate 897 141 – 505 6,074 – 7,617
Segment assets
Equity-accounted investments 7,329 3,212 – 1,071 – – 11,612
Additions to non-current assetsc22,603 5,246 – 1,419 – – 29,268
Additions to other investments 33
Element of acquisitions not related to non-current assets (72)
Additions to decommissioning asset (4,025)
Capital expenditure and acquisitions 18,520 5,249 – 1,435 – – 25,204
aSee explanation of inventory holding gains and losses on page 119.
bIt is estimated that the benefit arising from the absence of depreciation for the assets held for sale amounted to approximately $435 million.
cIncludes additions to property, plant and equipment; goodwill; intangible assets; investments in joint ventures; and investments in associates.
122 BP Annual Report and Form 20-F 2014