BP 2014 Annual Report Download - page 177
Download and view the complete annual report
Please find page 177 of the 2014 BP annual report below. You can navigate through the pages in the report by either clicking on the pages listed below, or by using the keyword search tool below to find specific information within the annual report.-
 1
1 -
2
-
3
-
4
-
5
-
6
-
7
-
8
-
9
-
10
-
11
-
12
-
13
-
14
-
15
-
16
-
17
-
18
-
19
-
20
-
21
-
22
-
23
-
24
-
25
-
26
-
27
-
28
-
29
-
30
-
31
-
32
-
33
-
34
-
35
-
36
-
37
-
38
-
39
-
40
-
41
-
42
-
43
-
44
-
45
-
46
-
47
-
48
-
49
-
50
-
51
-
52
-
53
-
54
-
55
-
56
-
57
-
58
-
59
-
60
-
61
-
62
-
63
-
64
-
65
-
66
-
67
-
68
-
69
-
70
-
71
-
72
-
73
-
74
-
75
-
76
-
77
-
78
-
79
-
80
-
81
-
82
-
83
-
84
-
85
-
86
-
87
-
88
-
89
-
90
-
91
-
92
-
93
-
94
-
95
-
96
-
97
-
98
-
99
-
100
-
101
-
102
-
103
-
104
-
105
-
106
-
107
-
108
-
109
-
110
-
111
-
112
-
113
-
114
-
115
-
116
-
117
-
118
-
119
-
120
-
121
-
122
-
123
-
124
-
125
-
126
-
127
-
128
-
129
-
130
-
131
-
132
-
133
-
134
-
135
-
136
-
137
-
138
-
139
-
140
-
141
-
142
-
143
-
144
-
145
-
146
-
147
-
148
-
149
-
150
-
151
-
152
-
153
-
154
-
155
-
156
-
157
-
158
-
159
-
160
-
161
-
162
-
163
-
164
-
165
-
166
-
 167
167 -
 168
168 -
 169
169 -
 170
170 -
 171
171 -
 172
172 -
 173
173 -
 174
174 -
 175
175 -
 176
176 -
 177
177 -
 178
178 -
 179
179 -
 180
180 -
 181
181 -
 182
182 -
 183
183 -
 184
184 -
 185
185 -
 186
186 -
 187
187 -
188
-
189
-
190
-
191
-
192
-
193
-
194
-
195
-
196
-
197
-
198
-
199
-
200
-
201
-
202
-
203
-
204
-
205
-
206
-
207
-
208
-
209
-
210
-
211
-
212
-
213
-
214
-
215
-
216
-
217
-
218
-
219
-
220
-
221
-
222
-
223
-
224
-
225
-
226
-
227
-
228
-
229
-
230
-
231
-
232
-
233
-
234
-
235
-
236
-
237
-
238
-
239
-
240
-
241
-
242
-
243
-
244
-
245
-
246
-
247
-
248
-
249
-
250
-
251
-
252
-
253
-
254
-
255
-
256
-
257
-
258
-
259
-
260
-
261
-
262
-
263
 |
 |

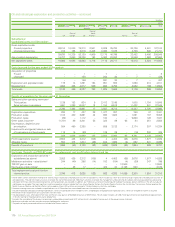
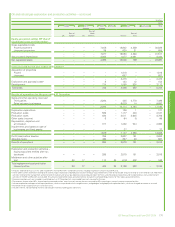
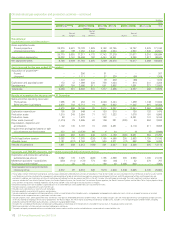
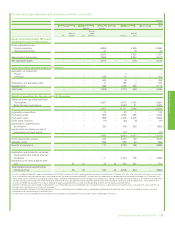
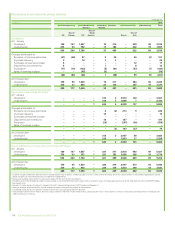
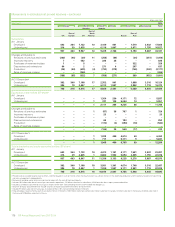
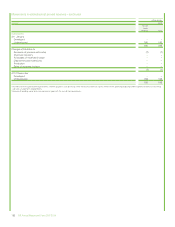
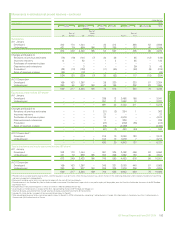
Oil and natural gas exploration and production activities – continued
$ million
2012
Europe North
America
South
America
Africa Asia Australasia Total
UK
Rest of
Europe US
Rest of
North
America Russiaa
Rest of
Asia
Equity-accounted entities (BP share)b
Capitalized costs at 31 Decemberc
Gross capitalized costs
Proved properties – – – – 6,958 – – 4,036 – 10,994
Unproved properties – – – – 21 – – 16 – 37
– – – – 6,979 – – 4,052 – 11,031
Accumulated depreciation – – – – 2,965 – – 3,648 – 6,613
Net capitalized costs – – – – 4,014 – – 404 – 4,418
Costs incurred for the year ended 31 Decemberc
Acquisition of propertiesd
Proved – – – – – – 4 – – 4
Unproved – – – – 439 – 15 – – 454
– – – – 439 – 19 – – 458
Exploration and appraisal costse– – – – 31 – 195 7 – 233
Development – – – – 599 – 1,560 556 – 2,715
Total costs – – – – 1,069 – 1,774 563 – 3,406
Results of operations for the year ended 31 December
Sales and other operating revenuesf
Third parties – – – – 2,267 – 6,472 4,245 – 12,984
Sales between businesses – – – – – – 3,639 21 – 3,660
– – – – 2,267 – 10,111 4,266 – 16,644
Exploration expenditure – – – – 31 – 93 1 – 125
Production costs – – – – 555 – 1,605 295 – 2,455
Production taxes – – – – 959 – 4,400 3,245 – 8,604
Other costs (income) – – – – (11) – (24) (2) – (37)
Depreciation, depletion and
amortization – – – – 328 – 786 538 – 1,652
Impairments and losses on sale of
businesses and fixed assets – – – – – – (27) – – (27)
– – – – 1,862 – 6,833 4,077 – 12,772
Profit (loss) before taxation – – – – 405 – 3,278 189 – 3,872
Allocable taxes – – – – 294 – 536 54 – 884
Results of operations – – – – 111 – 2,742 135 – 2,988
Exploration and production activities –
equity-accounted entities after tax
(as above) – – – – 111 – 2,742 135 – 2,988
Midstream and other activities after
taxg– 35 16 – 49 48 263 505 – 916
Total replacement cost profit after
interest and tax – 35 16 – 160 48 3,005 640 – 3,904
aThe Russia region includes BP’s equity-accounted share of TNK-BP’s earnings. For 2012, equity-accounted earnings are included until 21 October 2012 only, after which our investment was classified
as an asset held for sale and therefore equity accounting ceased. The amounts shown exclude BP’s share of costs incurred and results of operations for the period 22 October to 31 December 2012.
bThese tables contain information relating to oil and natural gas exploration and production activities of equity-accounted entities. They do not include amounts relating to assets held for sale. Midstream
activities relating to the management and ownership of crude oil and natural gas pipelines, processing and export terminals and LNG processing facilities and transportation as well as downstream
activities of TNK-BP are excluded. The amounts reported for equity-accounted entities exclude the corresponding amounts for their equity-accounted entities.
cDecommissioning assets are included in capitalized costs at 31 December but are excluded from costs incurred for the year. Capitalised costs exclude balances associated with assets held for sale.
dIncludes costs capitalized as a result of asset exchanges.
eIncludes exploration and appraisal drilling expenditures, which are capitalized within intangible assets, and geological and geophysical exploration costs, which are charged to income as incurred.
fPresented net of transportation costs and sales taxes.
gIncludes interest, non-controlling interests and the net results of equity-accounted entities and excludes inventory holding gains and losses.
Financial statements
BP Annual Report and Form 20-F 2014 173