BP 2014 Annual Report Download - page 162
Download and view the complete annual report
Please find page 162 of the 2014 BP annual report below. You can navigate through the pages in the report by either clicking on the pages listed below, or by using the keyword search tool below to find specific information within the annual report.-
 1
1 -
2
-
3
-
4
-
5
-
6
-
7
-
8
-
9
-
10
-
11
-
12
-
13
-
14
-
15
-
16
-
17
-
18
-
19
-
20
-
21
-
22
-
23
-
24
-
25
-
26
-
27
-
28
-
29
-
30
-
31
-
32
-
33
-
34
-
35
-
36
-
37
-
38
-
39
-
40
-
41
-
42
-
43
-
44
-
45
-
46
-
47
-
48
-
49
-
50
-
51
-
52
-
53
-
54
-
55
-
56
-
57
-
58
-
59
-
60
-
61
-
62
-
63
-
64
-
65
-
66
-
67
-
68
-
69
-
70
-
71
-
72
-
73
-
74
-
75
-
76
-
77
-
78
-
79
-
80
-
81
-
82
-
83
-
84
-
85
-
86
-
87
-
88
-
89
-
90
-
91
-
92
-
93
-
94
-
95
-
96
-
97
-
98
-
99
-
100
-
101
-
102
-
103
-
104
-
105
-
106
-
107
-
108
-
109
-
110
-
111
-
112
-
113
-
114
-
115
-
116
-
117
-
118
-
119
-
120
-
121
-
122
-
123
-
124
-
125
-
126
-
127
-
128
-
129
-
130
-
131
-
132
-
133
-
134
-
135
-
136
-
137
-
138
-
139
-
140
-
141
-
142
-
143
-
144
-
145
-
146
-
147
-
148
-
149
-
150
-
151
-
 152
152 -
 153
153 -
 154
154 -
 155
155 -
 156
156 -
 157
157 -
 158
158 -
 159
159 -
 160
160 -
 161
161 -
 162
162 -
 163
163 -
 164
164 -
 165
165 -
 166
166 -
 167
167 -
 168
168 -
 169
169 -
 170
170 -
 171
171 -
 172
172 -
173
-
174
-
175
-
176
-
177
-
178
-
179
-
180
-
181
-
182
-
183
-
184
-
185
-
186
-
187
-
188
-
189
-
190
-
191
-
192
-
193
-
194
-
195
-
196
-
197
-
198
-
199
-
200
-
201
-
202
-
203
-
204
-
205
-
206
-
207
-
208
-
209
-
210
-
211
-
212
-
213
-
214
-
215
-
216
-
217
-
218
-
219
-
220
-
221
-
222
-
223
-
224
-
225
-
226
-
227
-
228
-
229
-
230
-
231
-
232
-
233
-
234
-
235
-
236
-
237
-
238
-
239
-
240
-
241
-
242
-
243
-
244
-
245
-
246
-
247
-
248
-
249
-
250
-
251
-
252
-
253
-
254
-
255
-
256
-
257
-
258
-
259
-
260
-
261
-
262
-
263
 |
 |

31. Contingent liabilities – continued
The group files tax returns in many jurisdictions throughout the world. Various tax authorities are currently examining the group‘s tax returns. Tax
returns contain matters that could be subject to differing interpretations of applicable tax laws and regulations and the resolution of tax positions
through negotiations with relevant tax authorities, or through litigation, can take several years to complete. While it is difficult to predict the ultimate
outcome in some cases, the group does not anticipate that there will be any material impact upon the group‘s results of operations, financial position or
liquidity.
The group is subject to numerous national and local environmental laws and regulations concerning its products, operations and other activities. These
laws and regulations may require the group to take future action to remediate the effects on the environment of prior disposal or release of chemicals
or petroleum substances by the group or other parties. Such contingencies may exist for various sites including refineries, chemical plants, oil fields,
service stations, terminals and waste disposal sites. In addition, the group may have obligations relating to prior asset sales or closed facilities. The
ultimate requirement for remediation and its cost are inherently difficult to estimate. However, the estimated cost of known environmental obligations
has been provided in these accounts in accordance with the group‘s accounting policies. While the amounts of future costs that are not provided for
could be significant and could be material to the group‘s results of operations in the period in which they are recognized, it is not possible to estimate
the amounts involved. BP does not expect these costs to have a material effect on the group‘s financial position or liquidity.
If oil and natural gas production facilities and pipelines are sold to third parties and the subsequent owner is unable to meet their decommissioning
obligations it is possible that, in certain circumstances, BP could be partially or wholly responsible for decommissioning. Furthermore, as described in
Provisions, contingencies and reimbursement assets within Note 1, decommissioning provisions associated with downstream and petrochemical
facilities are not generally recognized as the potential obligations cannot be measured given their indeterminate settlement dates.
The group generally restricts its purchase of insurance to situations where this is required for legal or contractual reasons. This is because external
insurance is not considered an economic means of financing losses for the group. Losses will therefore be borne as they arise rather than being spread
over time through insurance premiums with attendant transaction costs. The position is reviewed periodically.
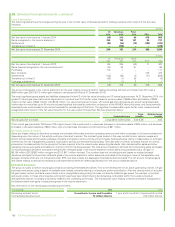
32. Remuneration of senior management and non-executive directors
Remuneration of directors
$ million
2014 2013 2012
Total for all directors
Emoluments 14 16 12
Amounts awarded under incentive schemes 14 23
Total 28 18 15
Emoluments
These amounts comprise fees paid to the non-executive chairman and the non-executive directors and, for executive directors, salary and benefits
earned during the relevant financial year, plus cash bonuses awarded for the year. There was no compensation for loss of office in 2014 (2013 $nil and
2012 $nil).
Pension contributions
During 2014 two executive directors participated in a non-contributory pension scheme established for UK employees by a separate trust fund to which
contributions are made by BP based on actuarial advice. One US executive director participated in the US BP Retirement Accumulation Plan during
2014.
Further information
Full details of individual directors’ remuneration are given in the Directors’ remuneration report on page 72.
Remuneration of senior management and non-executive directors
$ million
2014 2013 2012
Total for senior management and non-executive directors
Short-term employee benefits 34 36 29
Pensions and other post-retirement benefits 333
Share-based payments 34 43 37
Total 71 82 69
Senior management, comprises members of the executive team, see pages 56-57 for further information.
Short-term employee benefits
These amounts comprise fees and benefits paid to the non-executive chairman and non-executive directors, as well as salary, benefits and cash
bonuses for senior management. Deferred annual bonus awards, to be settled in shares, are included in share-based payments. Short-term employee
benefits includes compensation for loss of office of $1.5 million (2013 $3 million and 2012 $nil).
Pensions and other post-retirement benefits
The amounts represent the estimated cost to the group of providing defined benefit pensions and other post-retirement benefits to senior
management in respect of the current year of service measured in accordance with IAS 19 ‘Employee Benefits’.
Share-based payments
This is the cost to the group of senior management’s participation in share-based payment plans, as measured by the fair value of options and shares
granted, accounted for in accordance with IFRS 2 ‘Share-based Payments’.
158 BP Annual Report and Form 20-F 2014