BP 2014 Annual Report Download - page 137
Download and view the complete annual report
Please find page 137 of the 2014 BP annual report below. You can navigate through the pages in the report by either clicking on the pages listed below, or by using the keyword search tool below to find specific information within the annual report.-
 1
1 -
2
-
3
-
4
-
5
-
6
-
7
-
8
-
9
-
10
-
11
-
12
-
13
-
14
-
15
-
16
-
17
-
18
-
19
-
20
-
21
-
22
-
23
-
24
-
25
-
26
-
27
-
28
-
29
-
30
-
31
-
32
-
33
-
34
-
35
-
36
-
37
-
38
-
39
-
40
-
41
-
42
-
43
-
44
-
45
-
46
-
47
-
48
-
49
-
50
-
51
-
52
-
53
-
54
-
55
-
56
-
57
-
58
-
59
-
60
-
61
-
62
-
63
-
64
-
65
-
66
-
67
-
68
-
69
-
70
-
71
-
72
-
73
-
74
-
75
-
76
-
77
-
78
-
79
-
80
-
81
-
82
-
83
-
84
-
85
-
86
-
87
-
88
-
89
-
90
-
91
-
92
-
93
-
94
-
95
-
96
-
97
-
98
-
99
-
100
-
101
-
102
-
103
-
104
-
105
-
106
-
107
-
108
-
109
-
110
-
111
-
112
-
113
-
114
-
115
-
116
-
117
-
118
-
119
-
120
-
121
-
122
-
123
-
124
-
125
-
126
-
 127
127 -
 128
128 -
 129
129 -
 130
130 -
 131
131 -
 132
132 -
 133
133 -
 134
134 -
 135
135 -
 136
136 -
 137
137 -
 138
138 -
 139
139 -
 140
140 -
 141
141 -
 142
142 -
 143
143 -
 144
144 -
 145
145 -
 146
146 -
 147
147 -
148
-
149
-
150
-
151
-
152
-
153
-
154
-
155
-
156
-
157
-
158
-
159
-
160
-
161
-
162
-
163
-
164
-
165
-
166
-
167
-
168
-
169
-
170
-
171
-
172
-
173
-
174
-
175
-
176
-
177
-
178
-
179
-
180
-
181
-
182
-
183
-
184
-
185
-
186
-
187
-
188
-
189
-
190
-
191
-
192
-
193
-
194
-
195
-
196
-
197
-
198
-
199
-
200
-
201
-
202
-
203
-
204
-
205
-
206
-
207
-
208
-
209
-
210
-
211
-
212
-
213
-
214
-
215
-
216
-
217
-
218
-
219
-
220
-
221
-
222
-
223
-
224
-
225
-
226
-
227
-
228
-
229
-
230
-
231
-
232
-
233
-
234
-
235
-
236
-
237
-
238
-
239
-
240
-
241
-
242
-
243
-
244
-
245
-
246
-
247
-
248
-
249
-
250
-
251
-
252
-
253
-
254
-
255
-
256
-
257
-
258
-
259
-
260
-
261
-
262
-
263
 |
 |

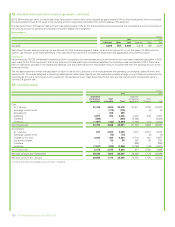
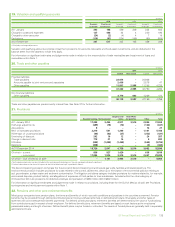
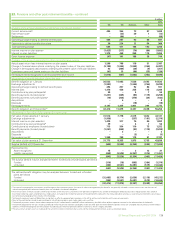
15. Investments in associates – continued
Summarized financial information for the group’s share of associates is shown below. Income statement and other comprehensive income information
shown below includes data relating to associates classified as assets held for sale during the period prior to their classification as assets held for sale.
$ million
BP share
2014 2013 2012
RosneftaOther Total Rosneft OtherbTotal TNK-BP Other Total
Sales and other operating revenues 28,214 9,724 37,938 24,266 12,998 37,264 24,675 11,965 36,640
Profit before interest and taxation 3,825 938 4,763 2,786 908 3,694 4,405 906 5,311
Finance costs 1,033 7 1,040 264 11 275 84 16 100
Profit before taxation 2,792 931 3,723 2,522 897 3,419 4,321 890 5,211
Taxation 677 230 907 422 213 635 979 201 1,180
Non-controlling interests 14 – 14 42 – 42 356 – 356
Profit for the year 2,101 701 2,802 2,058 684 2,742 2,986 689 3,675
Other comprehensive income (2,575) 10 (2,565) (87) 2 (85) 13 (6) 7
Total comprehensive income (474) 711 237 1,971 686 2,657 2,999 683 3,682
Non-current assets 19,962 2,975 22,937 29,457 3,148 32,605
Current assets 7,560 2,199 9,759 9,633 2,477 12,110
Total assets 27,522 5,174 32,696 39,090 5,625 44,715
Current liabilities 7,189 1,614 8,803 8,527 2,114 10,641
Non-current liabilities 12,890 921 13,811 16,483 1,053 17,536
Total liabilities 20,079 2,535 22,614 25,010 3,167 28,177
Net assets 7,443 2,639 10,082 14,080 2,458 16,538
Less: non-controlling interests 131 – 131 399 – 399
7,312 2,639 9,951 13,681 2,458 16,139
Group investment in associates
Group share of net assets (as above) 7,312 2,639 9,951 13,681 2,458 16,139
Loans made by group companies to
associates – 452 452 – 497 497
7,312 3,091 10,403 13,681 2,955 16,636
aOn 1 October 2014, Rosneft adopted hedge accounting in relation to a portion of highly probable future export revenue denominated in US dollars. Since 1 October 2014, foreign exchange gains and
losses arising on the retranslation of borrowings denominated in currencies other than the Russian rouble and designated as hedging instruments have been recognized initially in other comprehensive
income, and will be reclassified to the income statement as the hedged revenue is recognized over the next five years.
bAn amendment has been made to the amount previously disclosed for Sales and other operating revenues.
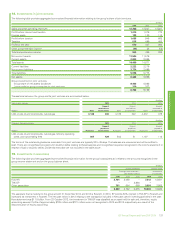
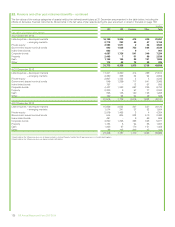
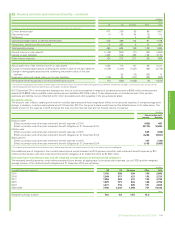
Transactions between the group and its associates are summarized below.
$ million
Sales to associates 2014 2013 2012
Product Sales
Amount
receivable at
31 December Sales
Amount
receivable at
31 December Sales
Amount
receivable at
31 December
LNG, crude oil and oil products, natural gas 9,589 1,258 5,170 783 3,771 401
$ million
Purchases from associates 2014 2013 2012
Product Purchases
Amount
payable at
31 December Purchases
Amount
payable at
31 December Purchases
Amount
payable at
31 December
Crude oil and oil products, natural gas, transportation tariff 22,703 2,307 21,205 3,470 9,135 932
The terms of the outstanding balances receivable from associates are typically 30 to 45 days. The balances are unsecured and will be settled in cash.
There are no significant provisions for doubtful debts relating to these balances and no significant expense recognized in the income statement in
respect of bad or doubtful debts. Dividends receivable are not included in the table above.
BP has commitments amounting to $6,946 million (2013 $6,077 million) in relation to contracts with its associates for the purchase of crude oil and oil
products, transportation and storage.
The majority of the sales to, purchases from, and commitments in relation to contracts with associates relate to crude oil and oil products transactions
with Rosneft.
Financial statements
BP Annual Report and Form 20-F 2014 133