BP 2014 Annual Report Download - page 174
Download and view the complete annual report
Please find page 174 of the 2014 BP annual report below. You can navigate through the pages in the report by either clicking on the pages listed below, or by using the keyword search tool below to find specific information within the annual report.-
 1
1 -
2
-
3
-
4
-
5
-
6
-
7
-
8
-
9
-
10
-
11
-
12
-
13
-
14
-
15
-
16
-
17
-
18
-
19
-
20
-
21
-
22
-
23
-
24
-
25
-
26
-
27
-
28
-
29
-
30
-
31
-
32
-
33
-
34
-
35
-
36
-
37
-
38
-
39
-
40
-
41
-
42
-
43
-
44
-
45
-
46
-
47
-
48
-
49
-
50
-
51
-
52
-
53
-
54
-
55
-
56
-
57
-
58
-
59
-
60
-
61
-
62
-
63
-
64
-
65
-
66
-
67
-
68
-
69
-
70
-
71
-
72
-
73
-
74
-
75
-
76
-
77
-
78
-
79
-
80
-
81
-
82
-
83
-
84
-
85
-
86
-
87
-
88
-
89
-
90
-
91
-
92
-
93
-
94
-
95
-
96
-
97
-
98
-
99
-
100
-
101
-
102
-
103
-
104
-
105
-
106
-
107
-
108
-
109
-
110
-
111
-
112
-
113
-
114
-
115
-
116
-
117
-
118
-
119
-
120
-
121
-
122
-
123
-
124
-
125
-
126
-
127
-
128
-
129
-
130
-
131
-
132
-
133
-
134
-
135
-
136
-
137
-
138
-
139
-
140
-
141
-
142
-
143
-
144
-
145
-
146
-
147
-
148
-
149
-
150
-
151
-
152
-
153
-
154
-
155
-
156
-
157
-
158
-
159
-
160
-
161
-
162
-
163
-
 164
164 -
 165
165 -
 166
166 -
 167
167 -
 168
168 -
 169
169 -
 170
170 -
 171
171 -
 172
172 -
 173
173 -
 174
174 -
 175
175 -
 176
176 -
 177
177 -
 178
178 -
 179
179 -
 180
180 -
 181
181 -
 182
182 -
 183
183 -
 184
184 -
185
-
186
-
187
-
188
-
189
-
190
-
191
-
192
-
193
-
194
-
195
-
196
-
197
-
198
-
199
-
200
-
201
-
202
-
203
-
204
-
205
-
206
-
207
-
208
-
209
-
210
-
211
-
212
-
213
-
214
-
215
-
216
-
217
-
218
-
219
-
220
-
221
-
222
-
223
-
224
-
225
-
226
-
227
-
228
-
229
-
230
-
231
-
232
-
233
-
234
-
235
-
236
-
237
-
238
-
239
-
240
-
241
-
242
-
243
-
244
-
245
-
246
-
247
-
248
-
249
-
250
-
251
-
252
-
253
-
254
-
255
-
256
-
257
-
258
-
259
-
260
-
261
-
262
-
263
 |
 |

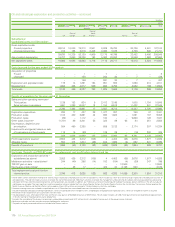
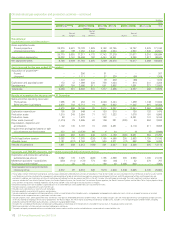
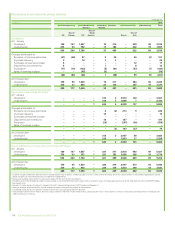
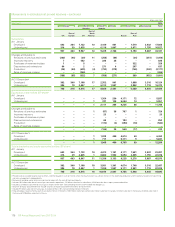
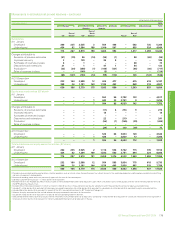
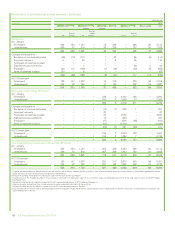
Oil and natural gas exploration and production activities – continued
$ million
2013
Europe North
America
South
America
Africa Asia Australasia Total
UK
Rest of
Europe US
Rest of
North
America Russia
Rest of
Asia
Subsidiariesa
Capitalized costs at 31 Decemberb
Gross capitalized costs
Proved properties 29,314 10,040 75,313 2,501 8,809 35,720 – 20,726 4,681 187,104
Unproved properties 316 195 6,816 2,408 3,366 5,079 – 2,756 805 21,741
29,630 10,235 82,129 4,909 12,175 40,799 – 23,482 5,486 208,845
Accumulated depreciation 18,707 3,650 38,236 193 5,063 20,082 – 10,069 1,962 97,962
Net capitalized costs 10,923 6,585 43,893 4,716 7,112 20,717 – 13,413 3,524 110,883
Costs incurred for the year ended 31 Decemberb
Acquisition of properties
Proved – – 1 – 7 – – – – 8
Unproved – – 158 – 284 30 – 7 – 479
– – 159 – 291 30 – 7 – 487
Exploration and appraisal costsc178 14 1,291 194 951 883 – 1,090 210 4,811
Development 1,942 455 4,877 569 683 2,755 – 2,082 189 13,552
Total costs 2,120 469 6,327 763 1,925 3,668 – 3,179 399 18,850
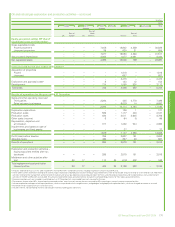
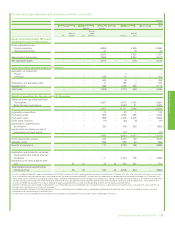
Results of operations for the year ended 31 December
Sales and other operating revenuesd
Third parties 1,129 183 934 5 2,413 3,195 – 1,005 1,784 10,648
Sales between businesses 1,661 1,280 14,047 12 1,154 6,518 – 11,432 941 37,045
2,790 1,463 14,981 17 3,567 9,713 – 12,437 2,725 47,693
Exploration expenditure 280 17 437 28 1,477 387 – 768 47 3,441
Production costs 1,102 430 3,691 42 892 1,623 – 1,091 187 9,058
Production taxes (35) – 1,112 – 184 – – 5,660 126 7,047
Other costs (income)e(1,731) 86 3,241 55 322 89 65 84 351 2,562
Depreciation, depletion and
amortization 504 490 3,268 – 559 3,132 – 2,174 207 10,334
Impairments and (gains) losses on sale
of businesses and fixed assets 118 15 (80) – 129 29 – (16) 230 425
238 1,038 11,669 125 3,563 5,260 65 9,761 1,148 32,867
Profit (loss) before taxationf2,552 425 3,312 (108) 4 4,453 (65) 2,676 1,577 14,826
Allocable taxes 554 475 1,204 (26) 642 1,925 (2) 682 641 6,095
Results of operations 1,998 (50) 2,108 (82) (638) 2,528 (63) 1,994 936 8,731
Upstream, Rosneft and TNK-BP segments replacement cost profit before interest and tax
Exploration and production activities –
subsidiaries (as above) 2,552 425 3,312 (108) 4 4,453 (65) 2,676 1,577 14,826
Midstream activities – subsidiariesg244 (40) 296 (14) 153 (154) (4) (29) 347 799
TNK-BP gain on sale – – – – – – 12,500 – – 12,500
Equity-accounted entitiesh– 28 17 – 405 24 2,158 553 – 3,185
Total replacement cost profit before
interest and tax 2,796 413 3,625 (122) 562 4,323 14,589 3,200 1,924 31,310
aThese tables contain information relating to oil and natural gas exploration and production activities of subsidiaries, which includes our share of oil and natural gas exploration and production activities of
joint operations. They do not include any costs relating to the Gulf of Mexico oil spill. Midstream activities relating to the management and ownership of crude oil and natural gas pipelines, processing
and export terminals and LNG processing facilities and transportation are excluded. In addition, our midstream activities of marketing and trading of natural gas, power and NGLs in the US, Canada, UK
and Europe are excluded. The most significant midstream pipeline interests include the Trans-Alaska Pipeline System, the Forties Pipeline System, the Central Area Transmission System pipeline, the
South Caucasus Pipeline and the Baku-Tbilisi-Ceyhan pipeline. Major LNG activities are located in Trinidad, Indonesia, Australia and Angola.
bDecommissioning assets are included in capitalized costs at 31 December but are excluded from costs incurred for the year.
cIncludes exploration and appraisal drilling expenditures, which are capitalized within intangible assets, and geological and geophysical exploration costs, which are charged to income as incurred.
dPresented net of transportation costs, purchases and sales taxes.
eIncludes property taxes, other government take and the fair value gain on embedded derivatives of $459 million. The UK region includes a $1,055 million gain offset by corresponding charges primarily
in the US, relating to the group self-insurance programme.
fExcludes the unwinding of the discount on provisions and payables amounting to $141 million which is included in finance costs in the group income statement.
gMidstream and other activities excludes inventory holding gains and losses.
hThe profits of equity-accounted entities are included after interest and tax.
170 BP Annual Report and Form 20-F 2014