BP 2014 Annual Report Download - page 151
Download and view the complete annual report
Please find page 151 of the 2014 BP annual report below. You can navigate through the pages in the report by either clicking on the pages listed below, or by using the keyword search tool below to find specific information within the annual report.-
 1
1 -
2
-
3
-
4
-
5
-
6
-
7
-
8
-
9
-
10
-
11
-
12
-
13
-
14
-
15
-
16
-
17
-
18
-
19
-
20
-
21
-
22
-
23
-
24
-
25
-
26
-
27
-
28
-
29
-
30
-
31
-
32
-
33
-
34
-
35
-
36
-
37
-
38
-
39
-
40
-
41
-
42
-
43
-
44
-
45
-
46
-
47
-
48
-
49
-
50
-
51
-
52
-
53
-
54
-
55
-
56
-
57
-
58
-
59
-
60
-
61
-
62
-
63
-
64
-
65
-
66
-
67
-
68
-
69
-
70
-
71
-
72
-
73
-
74
-
75
-
76
-
77
-
78
-
79
-
80
-
81
-
82
-
83
-
84
-
85
-
86
-
87
-
88
-
89
-
90
-
91
-
92
-
93
-
94
-
95
-
96
-
97
-
98
-
99
-
100
-
101
-
102
-
103
-
104
-
105
-
106
-
107
-
108
-
109
-
110
-
111
-
112
-
113
-
114
-
115
-
116
-
117
-
118
-
119
-
120
-
121
-
122
-
123
-
124
-
125
-
126
-
127
-
128
-
129
-
130
-
131
-
132
-
133
-
134
-
135
-
136
-
137
-
138
-
139
-
140
-
 141
141 -
 142
142 -
 143
143 -
 144
144 -
 145
145 -
 146
146 -
 147
147 -
 148
148 -
 149
149 -
 150
150 -
 151
151 -
 152
152 -
 153
153 -
 154
154 -
 155
155 -
 156
156 -
 157
157 -
 158
158 -
 159
159 -
 160
160 -
 161
161 -
162
-
163
-
164
-
165
-
166
-
167
-
168
-
169
-
170
-
171
-
172
-
173
-
174
-
175
-
176
-
177
-
178
-
179
-
180
-
181
-
182
-
183
-
184
-
185
-
186
-
187
-
188
-
189
-
190
-
191
-
192
-
193
-
194
-
195
-
196
-
197
-
198
-
199
-
200
-
201
-
202
-
203
-
204
-
205
-
206
-
207
-
208
-
209
-
210
-
211
-
212
-
213
-
214
-
215
-
216
-
217
-
218
-
219
-
220
-
221
-
222
-
223
-
224
-
225
-
226
-
227
-
228
-
229
-
230
-
231
-
232
-
233
-
234
-
235
-
236
-
237
-
238
-
239
-
240
-
241
-
242
-
243
-
244
-
245
-
246
-
247
-
248
-
249
-
250
-
251
-
252
-
253
-
254
-
255
-
256
-
257
-
258
-
259
-
260
-
261
-
262
-
263
 |
 |

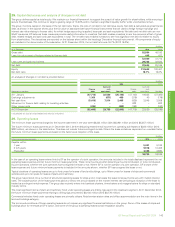
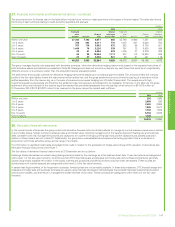
27. Financial instruments and financial risk factors – continued
The amounts shown for finance debt in the table below include future minimum lease payments with respect to finance leases. The table also shows
the timing of cash outflows relating to trade and other payables and accruals.
$ million
2014 2013
Trade and
other
payables Accruals
Finance
debt
Interest
relating to
finance debt
Trade and
other
payables Accruals
Finance
debt
Interest
relating to
finance debt
Within one year 37,342 7,102 6,877 892 43,790 8,960 7,381 885
1 to 2 years 708 493 6,311 776 1,007 207 6,630 752
2 to 3 years 757 119 5,652 672 822 66 6,720 621
3 to 4 years 1,446 76 5,226 578 761 73 5,828 498
4 to 5 years 23 41 6,056 479 1,405 37 5,279 388
5 to 10 years 24 95 19,504 1,111 207 113 15,933 809
Over 10 years 27 37 3,228 521 80 51 421 119
40,327 7,963 52,854 5,029 48,072 9,507 48,192 4,072
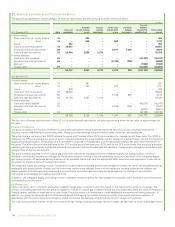
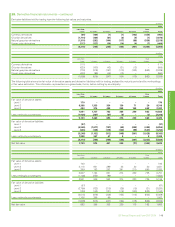
The group manages liquidity risk associated with derivative contracts, other than derivative hedging instruments, based on the expected maturitiesof
both derivative assets and liabilities as indicated in Note 28. Management does not currently anticipate any cash flows that could be of a significantly
different amount, or could occur earlier than the expected maturity analysis provided.
The table below shows cash outflows for derivative hedging instruments based upon contractual payment dates. The amounts reflect the maturity
profile of the fair value liability where the instruments will be settled net, and the gross settlement amount where the pay leg of a derivative will be
settled separately from the receive leg, as in the case of cross-currency swaps hedging non-US dollar finance debt. The swaps are with high
investment-grade counterparties and therefore the settlement-day risk exposure is considered to be negligible. Not shown in the table are the gross
settlement amounts (inflows) for the receive leg of derivatives that are settled separately from the pay leg, which amount to $14,615 million at
31 December 2014 (2013 $12,222 million) to be received on the same day as the related cash outflows.
$ million
2014 2013
Within one year 293 1,095
1 to 2 years 2,959 293
2 to 3 years 2,690 2,959
3 to 4 years 1,505 2,577
4 to 5 years 1,700 1,505
5 to 10 years 5,764 3,835
Over 10 years 1,325 –
16,236 12,264
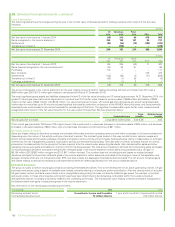
28. Derivative financial instruments
In the normal course of business the group enters into derivative financial instruments (derivatives) to manage its normal business exposures in relation
to commodity prices, foreign currency exchange rates and interest rates, including management of the balance between floating rate and fixed rate
debt, consistent with risk management policies and objectives. An outline of the group’s financial risks and the objectives and policies pursued in
relation to those risks is set out in Note 27. Additionally, the group has a well-established entrepreneurial trading operation that is undertaken in
conjunction with these activities using a similar range of contracts.
For information on significant estimates and judgements made in relation to the application of hedge accounting and the valuation of derivatives see
Derivative financial instruments within Note 1.
The fair values of derivative financial instruments at 31 December are set out below.
Exchange traded derivatives are valued using closing prices provided by the exchange as at the balance sheet date. These derivatives are categorized
within level 1 of the fair value hierarchy. Over-the-counter (OTC) financial swaps and physical commodity sale and purchase contracts are generally
valued using readily available information in the public markets and quotations provided by brokers and price index developers. These quotes are
corroborated with market data and are categorized within level 2 of the fair value hierarchy.
In certain less liquid markets, or for longer-term contracts, forward prices are not as readily available. In these circumstances, OTC financial swaps and
physical commodity sale and purchase contracts are valued using internally developed methodologies that consider historical relationships between
various commodities, and that result in management’s best estimate of fair value. These contracts are categorized within level 3 of the fair value
hierarchy.
Financial statements
BP Annual Report and Form 20-F 2014 147