BP 2014 Annual Report Download - page 129
Download and view the complete annual report
Please find page 129 of the 2014 BP annual report below. You can navigate through the pages in the report by either clicking on the pages listed below, or by using the keyword search tool below to find specific information within the annual report.-
 1
1 -
2
-
3
-
4
-
5
-
6
-
7
-
8
-
9
-
10
-
11
-
12
-
13
-
14
-
15
-
16
-
17
-
18
-
19
-
20
-
21
-
22
-
23
-
24
-
25
-
26
-
27
-
28
-
29
-
30
-
31
-
32
-
33
-
34
-
35
-
36
-
37
-
38
-
39
-
40
-
41
-
42
-
43
-
44
-
45
-
46
-
47
-
48
-
49
-
50
-
51
-
52
-
53
-
54
-
55
-
56
-
57
-
58
-
59
-
60
-
61
-
62
-
63
-
64
-
65
-
66
-
67
-
68
-
69
-
70
-
71
-
72
-
73
-
74
-
75
-
76
-
77
-
78
-
79
-
80
-
81
-
82
-
83
-
84
-
85
-
86
-
87
-
88
-
89
-
90
-
91
-
92
-
93
-
94
-
95
-
96
-
97
-
98
-
99
-
100
-
101
-
102
-
103
-
104
-
105
-
106
-
107
-
108
-
109
-
110
-
111
-
112
-
113
-
114
-
115
-
116
-
117
-
118
-
 119
119 -
 120
120 -
 121
121 -
 122
122 -
 123
123 -
 124
124 -
 125
125 -
 126
126 -
 127
127 -
 128
128 -
 129
129 -
 130
130 -
 131
131 -
 132
132 -
 133
133 -
 134
134 -
 135
135 -
 136
136 -
 137
137 -
 138
138 -
 139
139 -
140
-
141
-
142
-
143
-
144
-
145
-
146
-
147
-
148
-
149
-
150
-
151
-
152
-
153
-
154
-
155
-
156
-
157
-
158
-
159
-
160
-
161
-
162
-
163
-
164
-
165
-
166
-
167
-
168
-
169
-
170
-
171
-
172
-
173
-
174
-
175
-
176
-
177
-
178
-
179
-
180
-
181
-
182
-
183
-
184
-
185
-
186
-
187
-
188
-
189
-
190
-
191
-
192
-
193
-
194
-
195
-
196
-
197
-
198
-
199
-
200
-
201
-
202
-
203
-
204
-
205
-
206
-
207
-
208
-
209
-
210
-
211
-
212
-
213
-
214
-
215
-
216
-
217
-
218
-
219
-
220
-
221
-
222
-
223
-
224
-
225
-
226
-
227
-
228
-
229
-
230
-
231
-
232
-
233
-
234
-
235
-
236
-
237
-
238
-
239
-
240
-
241
-
242
-
243
-
244
-
245
-
246
-
247
-
248
-
249
-
250
-
251
-
252
-
253
-
254
-
255
-
256
-
257
-
258
-
259
-
260
-
261
-
262
-
263
 |
 |

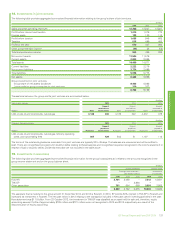
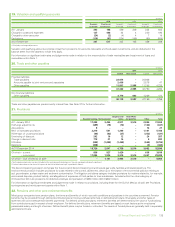
7. Taxation – continued
$ million
2014
excluding
impairments
2014
impacts of
impairments 2014 2013 2012
Profit (loss) before taxation 13,166 (8,216) 4,950 30,221 18,131
Tax charge (credit) on profit or loss 5,036 (4,089) 947 6,463 6,880
Effective tax rate 38% 50% 19% 21% 38%
% of profit before taxation
UK statutory corporation tax rate 21 21 21 23 24
Increase (decrease) resulting from
UK supplementary and overseas taxes at higher or lower ratesa17 34 (11) 412
Tax reported in equity-accounted entities (5) – (14) (2) (5)
Adjustments in respect of prior years (2) – (6) 11
Movement in deferred tax not recognized 4 (3) 17 22
Tax incentives for investment (4) – (10) (2) (2)
Gulf of Mexico oil spill non-deductible costs ––1–8
Permanent differences relating to disposalsb(1) – (1) (8) –
Foreign exchange 4–102 (1)
Items not deductible for tax purposes 4 (2) 12 12
Other –––– (3)
Effective tax rate 38 50 19 21 38
aFor 2014 excluding impairments, jurisdictions which contribute significantly to this item are Angola, with an applicable statutory tax rate of 50%, Trinidad, with an applicable statutory tax rate of 55%
and the US with an applicable federal tax rate of 35%. For 2014, impairment charges have generated losses on which tax credits arise, mainly in Norway and the UK North Sea, with applicable statutory
tax rates of 78% and 62% respectively. For 2013 and 2012, jurisdictions which contribute significantly are Angola, the UK and Trinidad with rates as disclosed above.
bFor 2013, this relates to the non-taxable gain on disposal of our investment in TNK-BP.
Legislation to reduce the UK supplementary charge tax rate applicable to profits arising in the North Sea is expected to be enacted in 2015. The
evaluation of the effect of this change for BP has not yet been completed.
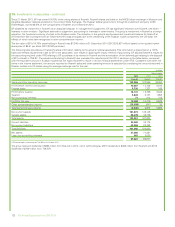
Deferred tax
$ million
Income statement Balance sheet
2014 2013 2012 2014 2013
Deferred tax liability
Depreciation (2,178) (474) (75) 29,062 31,551
Pension plan surpluses (272) (691) – –284
Other taxable temporary differences (1,278) (199) (2,239) 2,445 3,653
(3,728) (1,364) (2,314) 31,507 35,488
Deferred tax asset
Pension plan and other post-retirement benefit plan deficits 492 787 (33) (2,761) (2,026)
Decommissioning, environmental and other provisions 52 1,385 1,872 (11,237) (11,301)
Derivative financial instruments 166 30 (7) (575) (579)
Tax credits 589 (174) 1,802 (298) (888)
Loss carry forward (1,397) (343) (911) (3,848) (2,585)
Other deductible temporary differences 281 357 (445) (1,204) (1,655)
183 2,042 2,278 (19,923) (19,034)
Net deferred tax charge (credit) and net deferred tax liability (3,545) 678 (36) 11,584 16,454
Of which – deferred tax liabilities 13,893 17,439
– deferred tax assets 2,309 985
The recognition of deferred tax assets of $1,467 million (2013 $67 million), in entities which have suffered a loss in either the current or preceding
period, is supported by forecasts which indicate that sufficient future taxable profits will be available to utilize such assets.
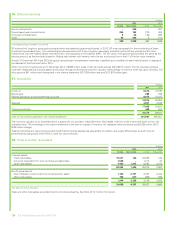
$ million
Analysis of movements during the year in the net deferred tax liability 2014 2013
At 1 January 16,454 14,369
Exchange adjustments 122 43
Charge (credit) for the year on profit (3,545) 678
Charge (credit) for the year in other comprehensive income (1,563) 1,397
Charge (credit) for the year in equity 36 (33)
Acquisitions 80 –
At 31 December 11,584 16,454
Financial statements
BP Annual Report and Form 20-F 2014 125