BP 2014 Annual Report Download - page 147
Download and view the complete annual report
Please find page 147 of the 2014 BP annual report below. You can navigate through the pages in the report by either clicking on the pages listed below, or by using the keyword search tool below to find specific information within the annual report.-
 1
1 -
2
-
3
-
4
-
5
-
6
-
7
-
8
-
9
-
10
-
11
-
12
-
13
-
14
-
15
-
16
-
17
-
18
-
19
-
20
-
21
-
22
-
23
-
24
-
25
-
26
-
27
-
28
-
29
-
30
-
31
-
32
-
33
-
34
-
35
-
36
-
37
-
38
-
39
-
40
-
41
-
42
-
43
-
44
-
45
-
46
-
47
-
48
-
49
-
50
-
51
-
52
-
53
-
54
-
55
-
56
-
57
-
58
-
59
-
60
-
61
-
62
-
63
-
64
-
65
-
66
-
67
-
68
-
69
-
70
-
71
-
72
-
73
-
74
-
75
-
76
-
77
-
78
-
79
-
80
-
81
-
82
-
83
-
84
-
85
-
86
-
87
-
88
-
89
-
90
-
91
-
92
-
93
-
94
-
95
-
96
-
97
-
98
-
99
-
100
-
101
-
102
-
103
-
104
-
105
-
106
-
107
-
108
-
109
-
110
-
111
-
112
-
113
-
114
-
115
-
116
-
117
-
118
-
119
-
120
-
121
-
122
-
123
-
124
-
125
-
126
-
127
-
128
-
129
-
130
-
131
-
132
-
133
-
134
-
135
-
136
-
 137
137 -
 138
138 -
 139
139 -
 140
140 -
 141
141 -
 142
142 -
 143
143 -
 144
144 -
 145
145 -
 146
146 -
 147
147 -
 148
148 -
 149
149 -
 150
150 -
 151
151 -
 152
152 -
 153
153 -
 154
154 -
 155
155 -
 156
156 -
 157
157 -
158
-
159
-
160
-
161
-
162
-
163
-
164
-
165
-
166
-
167
-
168
-
169
-
170
-
171
-
172
-
173
-
174
-
175
-
176
-
177
-
178
-
179
-
180
-
181
-
182
-
183
-
184
-
185
-
186
-
187
-
188
-
189
-
190
-
191
-
192
-
193
-
194
-
195
-
196
-
197
-
198
-
199
-
200
-
201
-
202
-
203
-
204
-
205
-
206
-
207
-
208
-
209
-
210
-
211
-
212
-
213
-
214
-
215
-
216
-
217
-
218
-
219
-
220
-
221
-
222
-
223
-
224
-
225
-
226
-
227
-
228
-
229
-
230
-
231
-
232
-
233
-
234
-
235
-
236
-
237
-
238
-
239
-
240
-
241
-
242
-
243
-
244
-
245
-
246
-
247
-
248
-
249
-
250
-
251
-
252
-
253
-
254
-
255
-
256
-
257
-
258
-
259
-
260
-
261
-
262
-
263
 |
 |

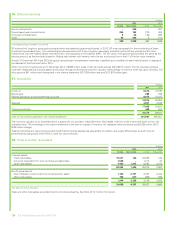
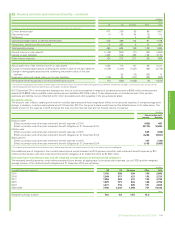
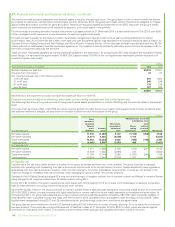
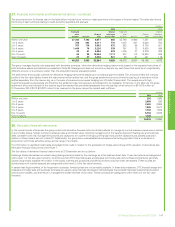
25. Capital disclosures and analysis of changes in net debt
The group defines capital as total equity. We maintain our financial framework to support the pursuit of value growth for shareholders, while ensuringa
secure financial base. We continue to target a gearing range of 10-20% and to maintain a significant liquidity buffer while uncertainties remain.
The group monitors capital on the basis of the net debt ratio, that is, the ratio of net debt to net debt plus equity. Net debt is calculated as gross finance
debt, as shown in the balance sheet, plus the fair value of associated derivative financial instruments that are used to hedge foreign exchange and
interest rate risks relating to finance debt, for which hedge accounting is applied, less cash and cash equivalents. Net debt and net debt ratio are non-
GAAP measures. BP believes these measures provide useful information to investors. Net debt enables investors to see the economic effect of gross
debt, related hedges and cash and cash equivalents in total. The net debt ratio enables investors to see how significant net debt is relative to equity
from shareholders. The derivatives are reported on the balance sheet within the headings ‘Derivative financial instruments’. All components of equity
are included in the denominator of the calculation. At 31 December 2014, the net debt ratio was 16.7% (2013 16.2%).
$ million
At 31 December 2014 2013
Gross debt 52,854 48,192
Less: fair value asset of hedges related to finance debt 445 477
52,409 47,715
Less: cash and cash equivalents 29,763 22,520
Net debt 22,646 25,195
Equity 112,642 130,407
Net debt ratio 16.7% 16.2%
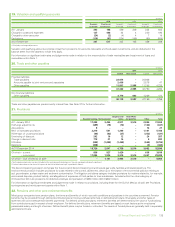
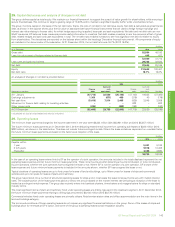
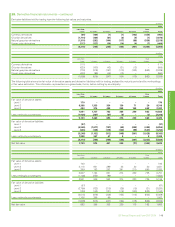
An analysis of changes in net debt is provided below.
$ million
2014 2013
Movement in net debt
Finance
debta
Cash and
cash
equivalents Net debt
Finance
debta
Cash and
cash
equivalents Net debt
At 1 January (47,715) 22,520 (25,195) (47,100) 19,635 (27,465)
Exchange adjustments 1,160 (671) 489 (219) 40 (179)
Net cash flow (5,419) 7,914 2,495 (836) 2,845 2,009
Movement in finance debt relating to investing activities –––632 – 632
Other movements (435) – (435) (192) – (192)
At 31 December (52,409) 29,763 (22,646) (47,715) 22,520 (25,195)
aIncluding the fair value of associated derivative financial instruments.
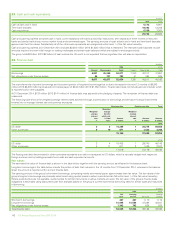
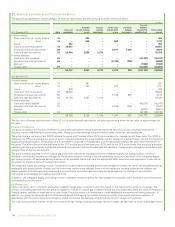
26. Operating leases
The minimum lease payments charged to the income statement in the year were $6,324 million (2013 $5,961 million and 2012 $5,257 million).
The future minimum lease payments at 31 December 2014, before deducting related rental income from operating sub-leases of $234 million (2013
$223 million), are shown in the table below. This does not include future contingent rentals. Where the lease rentals are dependent on a variable factor,
the future minimum lease payments are based on the factor as at inception of the lease.
$ million
Future minimum lease payments 2014 2013
Payable within
1 year 5,401 5,188
2 to 5 years 9,916 10,408
Thereafter 3,468 3,590
18,785 19,186
In the case of an operating lease entered into by BP as the operator of a joint operation, the amounts included in the totals disclosed represent the net
operating lease expense and net future minimum lease payments. These net amounts are after deducting amounts reimbursed, or to be reimbursed,
by joint operators, whether the joint operators have co-signed the lease or not. Where BP is not the operator of a joint operation, BP’s share of the
lease expense and future minimum lease payments is included in the amounts shown, whether BP has co-signed the lease or not.
Typical durations of operating leases are up to forty years for leases of land and buildings, up to fifteen years for leases of ships and commercial
vehicles and up to ten years for leases of plant and machinery.
The group has entered into a number of structured operating leases for ships and in most cases the lease rental payments vary with market interest
rates. The variable portion of the lease payments above or below the amount based on the market interest rate prevailing at inception of the lease is
treated as contingent rental expense. The group also routinely enters into bareboat charters, time-charters and voyage-charters for ships on standard
industry terms.
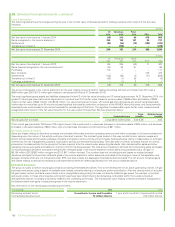
The most significant items of plant and machinery hired under operating leases are drilling rigs used in the Upstream segment. At 31 December 2014,
the future minimum lease payments relating to drilling rigs amounted to $8,180 million (2013 $8,776 million).
Commercial vehicles hired under operating leases are primarily railcars. Retail service station sites and office accommodation are the main items inthe
land and buildings category.
The terms and conditions of these operating leases do not impose any significant financial restrictions on the group. Some of the leases of ships and
buildings allow for renewals at BP’s option, and some of the group’s operating leases contain escalation clauses.
Financial statements
BP Annual Report and Form 20-F 2014 143