BP 2014 Annual Report Download - page 224
Download and view the complete annual report
Please find page 224 of the 2014 BP annual report below. You can navigate through the pages in the report by either clicking on the pages listed below, or by using the keyword search tool below to find specific information within the annual report.-
 1
1 -
2
-
3
-
4
-
5
-
6
-
7
-
8
-
9
-
10
-
11
-
12
-
13
-
14
-
15
-
16
-
17
-
18
-
19
-
20
-
21
-
22
-
23
-
24
-
25
-
26
-
27
-
28
-
29
-
30
-
31
-
32
-
33
-
34
-
35
-
36
-
37
-
38
-
39
-
40
-
41
-
42
-
43
-
44
-
45
-
46
-
47
-
48
-
49
-
50
-
51
-
52
-
53
-
54
-
55
-
56
-
57
-
58
-
59
-
60
-
61
-
62
-
63
-
64
-
65
-
66
-
67
-
68
-
69
-
70
-
71
-
72
-
73
-
74
-
75
-
76
-
77
-
78
-
79
-
80
-
81
-
82
-
83
-
84
-
85
-
86
-
87
-
88
-
89
-
90
-
91
-
92
-
93
-
94
-
95
-
96
-
97
-
98
-
99
-
100
-
101
-
102
-
103
-
104
-
105
-
106
-
107
-
108
-
109
-
110
-
111
-
112
-
113
-
114
-
115
-
116
-
117
-
118
-
119
-
120
-
121
-
122
-
123
-
124
-
125
-
126
-
127
-
128
-
129
-
130
-
131
-
132
-
133
-
134
-
135
-
136
-
137
-
138
-
139
-
140
-
141
-
142
-
143
-
144
-
145
-
146
-
147
-
148
-
149
-
150
-
151
-
152
-
153
-
154
-
155
-
156
-
157
-
158
-
159
-
160
-
161
-
162
-
163
-
164
-
165
-
166
-
167
-
168
-
169
-
170
-
171
-
172
-
173
-
174
-
175
-
176
-
177
-
178
-
179
-
180
-
181
-
182
-
183
-
184
-
185
-
186
-
187
-
188
-
189
-
190
-
191
-
192
-
193
-
194
-
195
-
196
-
197
-
198
-
199
-
200
-
201
-
202
-
203
-
204
-
205
-
206
-
207
-
208
-
209
-
210
-
211
-
212
-
213
-
 214
214 -
 215
215 -
 216
216 -
 217
217 -
 218
218 -
 219
219 -
 220
220 -
 221
221 -
 222
222 -
 223
223 -
 224
224 -
 225
225 -
 226
226 -
 227
227 -
 228
228 -
 229
229 -
 230
230 -
 231
231 -
 232
232 -
 233
233 -
 234
234 -
235
-
236
-
237
-
238
-
239
-
240
-
241
-
242
-
243
-
244
-
245
-
246
-
247
-
248
-
249
-
250
-
251
-
252
-
253
-
254
-
255
-
256
-
257
-
258
-
259
-
260
-
261
-
262
-
263
 |
 |

process and verification that the proved reserves estimates and the
related financial impacts are reported in a timely manner.
• Capital allocation processes, whereby delegated authority is exercised
to commit to capital projects that are consistent with the delivery of
the group’s business plan. A formal review process exists to ensure
that both technical and commercial criteria are met prior to the
commitment of capital to projects.
• Group audit, whose role is to consider whether the group’s system of
internal control is adequately designed and operating effectively to
respond appropriately to the risks that are significant to BP.
• Approval hierarchy, whereby proved reserves changes above certain
threshold volumes require central authorization and periodic reviews.
The frequency of review is determined according to field size and
ensures that more than 80% of the BP proved reserves base
undergoes central review every two years, and more than 90% is
reviewed centrally every four years.
BP’s vice president of segment reserves is the petroleum engineer
primarily responsible for overseeing the preparation of the reserves
estimate. He has more than 30 years of diversified industry experience
with the past 10 spent managing the governance and compliance of BP’s
reserves estimation. He is a past member of the Society of Petroleum
Engineers Oil and Gas Reserves Committee and of the American
Association of Petroleum Geologists Committee on Resource Evaluation
and is the current chair of the bureau of the United Nations Economic
Commission for Europe Expert Group on Resource Classification.
No specific portion of compensation bonuses for senior management is
directly related to proved reserves targets. Additions to proved reserves
is one of several indicators by which the performance of the Upstream
segment is assessed by the remuneration committee for the purposes of
determining compensation bonuses for the executive directors. Other
indicators include a number of financial and operational measures.
BP’s variable pay programme for the other senior managers in the
Upstream segment is based on individual performance contracts.
Individual performance contracts are based on agreed items from the
business performance plan, one of which, if chosen, could relate to
proved reserves.
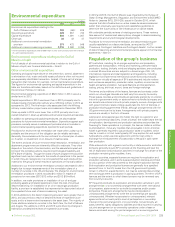
Compliance
International Financial Reporting Standards (IFRS) do not provide specific
guidance on reserves disclosures. BP estimates proved reserves in
accordance with SEC Rule 4-10 (a) of Regulation S-X and relevant
Compliance and Disclosure Interpretations (C&DI) and Staff Accounting
Bulletins as issued by the SEC staff.
By their nature, there is always some risk involved in the ultimate
development and production of proved reserves including, but not limited
to: final regulatory approval; the installation of new or additional
infrastructure, as well as changes in oil and gas prices; changes in
operating and development costs; and the continued availability of
additional development capital. All the group’s proved reserves held in
subsidiaries and equity-accounted entities with the exception of those
proved reserves held by our Russian equity-accounted entity, Rosneft are
estimated by the group’s petroleum engineers.
DeGolyer & MacNaughton (D&M), an independent petroleum engineering
consulting firm, has estimated the net proved crude oil, condensate, natural
gas liquids (NGLs) and natural gas reserves, as of 31 December 2014, of
certain properties owned by Rosneft. The properties evaluated by D&M
account for 100% of Rosneft’s net proved reserves as of 31 December
2014. The net proved reserves estimates prepared by D&M were prepared
in accordance with the reserves definitions of Rule 4-10(a)(1)-(32) of
Regulation S-X. All reserves estimates involve some degree of uncertainty.
BP has filed D&M’s independent report on its reserves estimates as an
exhibit to its Annual Report on Form 20-F filed with the SEC.
Our proved reserves are associated with both concessions (tax and
royalty arrangements) and agreements where the group is exposed to
the upstream risks and rewards of ownership, but where our entitlement
to the hydrocarbons is calculated using a more complex formula, such as
with PSAs. In a concession, the consortium of which we are a part is
entitled to the proved reserves that can be produced over the licence
period, which may be the life of the field. In a PSA, we are entitled to
recover volumes that equate to costs incurred to develop and produce
the proved reserves and an agreed share of the remaining volumes or the
economic equivalent. As part of our entitlement is driven by the monetary
amount of costs to be recovered, price fluctuations will have an impact
on both production volumes and reserves.
We disclose our share of proved reserves held in equity-accounted
entities (joint ventures*and associates*), although we do not control
these entities or the assets held by such entities.
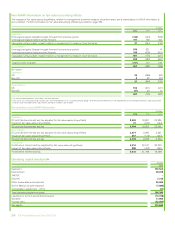
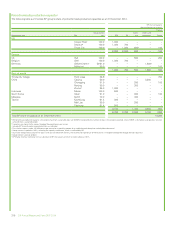
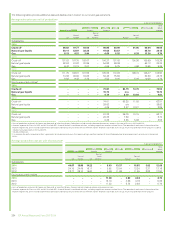
BP’s estimated net proved reserves and proved reserves
replacement
Eighty-four per cent of our total proved reserves of subsidiaries at
31 December 2014 were held through joint operations (83% in 2013),
and 33% of the proved reserves were held through such joint operations
where we were not the operator (31% in 2013).
Estimated net proved reserves of crude oil at 31 December 2014abc
million barrels
Developed Undeveloped Total
UK 159 329 488
Rest of Europe 95 22 117
US 1,030 664 1,694
Rest of North America 9 163 172
South America 10 22 32
Africa 317 120 437
Rest of Asia 384 197 581
Australasia 40 19 59
Subsidiaries*2,043 1,538 3,582
Equity-accounted entities 3,405 2,258 5,663
Total 5,448 3,796 9,244
Estimated net proved reserves of natural gas liquids at 31 December 2014
ab
million barrels
Developed Undeveloped Total
UK 6 3 9
Rest of Europe 13 1 14
US 323 104 427
Rest of North America – – –
South America 11 28 39
Africa 5 7 12
Rest of Asia – – –
Australasia 6 3 10
Subsidiaries 364 146 510
Equity-accounted entities 46 16 62
Total 410 163 572
Estimated net proved reserves of liquids*
million barrels
Developed Undeveloped Total
Subsidiaries 2,407 1,684 4,092de
Equity-accounted entities 3,451 2,274 5,725f
Total 5,858 3,958 9,817
Estimated net proved reserves of natural gas at 31 December 2014
ab
billion cubic feet
Developed Undeveloped Total
UK 382 386 768
Rest of Europe 300 19 318
US 7,168 2,447 9,615
Rest of North America 17 – 17
South America 2,352 6,313 8,666
Africa 901 1,597 2,497
Rest of Asia 1,688 3,892 5,580
Australasia 3,316 1,719 5,035
Subsidiaries 16,124 16,372 32,496g
Equity-accounted entities 6,363 5,837 12,200h
Total 22,487 22,209 44,695
220 BP Annual Report and Form 20-F 2014