Audi 2007 Annual Report Download - page 238
Download and view the complete annual report
Please find page 238 of the 2007 Audi annual report below. You can navigate through the pages in the report by either clicking on the pages listed below, or by using the keyword search tool below to find specific information within the annual report.-
 1
1 -
2
-
3
-
4
-
5
-
6
-
7
-
8
-
9
-
10
-
11
-
12
-
13
-
14
-
15
-
16
-
17
-
18
-
19
-
20
-
21
-
22
-
23
-
24
-
25
-
26
-
27
-
28
-
29
-
30
-
31
-
32
-
33
-
34
-
35
-
36
-
37
-
38
-
39
-
40
-
41
-
42
-
43
-
44
-
45
-
46
-
47
-
48
-
49
-
50
-
51
-
52
-
53
-
54
-
55
-
56
-
57
-
58
-
59
-
60
-
61
-
62
-
63
-
64
-
65
-
66
-
67
-
68
-
69
-
70
-
71
-
72
-
73
-
74
-
75
-
76
-
77
-
78
-
79
-
80
-
81
-
82
-
83
-
84
-
85
-
86
-
87
-
88
-
89
-
90
-
91
-
92
-
93
-
94
-
95
-
96
-
97
-
98
-
99
-
100
-
101
-
102
-
103
-
104
-
105
-
106
-
107
-
108
-
109
-
110
-
111
-
112
-
113
-
114
-
115
-
116
-
117
-
118
-
119
-
120
-
121
-
122
-
123
-
124
-
125
-
126
-
127
-
128
-
129
-
130
-
131
-
132
-
133
-
134
-
135
-
136
-
137
-
138
-
139
-
140
-
141
-
142
-
143
-
144
-
145
-
146
-
147
-
148
-
149
-
150
-
151
-
152
-
153
-
154
-
155
-
156
-
157
-
158
-
159
-
160
-
161
-
162
-
163
-
164
-
165
-
166
-
167
-
168
-
169
-
170
-
171
-
172
-
173
-
174
-
175
-
176
-
177
-
178
-
179
-
180
-
181
-
182
-
183
-
184
-
185
-
186
-
187
-
188
-
189
-
190
-
191
-
192
-
193
-
194
-
195
-
196
-
197
-
198
-
199
-
200
-
201
-
202
-
203
-
204
-
205
-
206
-
207
-
208
-
209
-
210
-
211
-
212
-
213
-
214
-
215
-
216
-
217
-
218
-
219
-
220
-
221
-
222
-
223
-
224
-
225
-
226
-
227
-
 228
228 -
 229
229 -
 230
230 -
 231
231 -
 232
232 -
 233
233 -
 234
234 -
 235
235 -
 236
236 -
 237
237 -
 238
238 -
 239
239
 |
 |

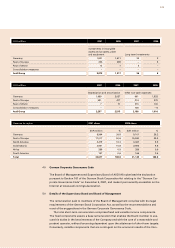
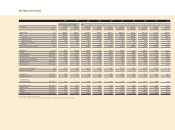
10-Year Overview
1998 1999 2000 2001 2002 2003 2004 2005 2006 2007
German Commercial Code (HGB) IFRS
Production Cars 619,030 626,059 650,850 727,033 735,913 761,582 784,972 811,522 926,180 980,880
Engines 1,241,351 1,266,896 1,187,666 1,225,448 1,284,488 1,342,883 1,485,536 1,695,045 1,895,695 1,915,633
Vehicle sales Cars 599,509 634,973 919,621 991,444 995,531 1,003,791 971,832 1,045,114 1,135,554 1,200,701
Audi Cars 599,509 634,708 653,404 726,134 742,128 769,893 779,441 829,109 905,188 964,151
Germany Cars 244,127 257,642 239,644 254,866 243,650 237,786 235,092 247,125 257,792 254,014
Outside Germany Cars 355,382 377,066 413,760 471,268 498,478 532,107 544,349 581,984 647,396 710,137
Outside Germany Percent 59.3 59.4 63.3 64.9 67.2 69.1 69.8 70.2 71.5 73.7
Market share, Germany Percent 6.5 6.8 6.9 7.5 7.4 7.4 7.2 7.4 7.6 7.9
Lamborghini Cars – 265 296 297 424 1,305 1,592 1,600 2,087 2,406
Other Volkswagen Group brands Cars – – 265,921 265,013 252,979 232,593 190,799 214,405 228,279 234,144
Employees Average 41,011 45,800 49,396 51,141 51,198 52,689 53,144 52,412 52,297 53,347
Revenue EUR million 13,918 15,146 19,952 22,032 22,603 23,406 24,506 26,591 31,142 33,617
Cost of materials EUR million 9,578 10,155 14,539 15,860 16,726 17,163 17,676 19,139 21,627 23,092
Personnel costs EUR million 2,111 2,291 2,542 2,660 2,739 2,938 3,072 3,136 3,440 3,406
Personnel costs per employee EUR 51,485 50,022 51,456 52,018 53,496 55,763 57,798 59,834 65,771 63,846
Depreciation and amortization EUR million 885 945 1,179 1,412 1,614 1,833 1,852 1,930 2,515 2,287
Profit before tax EUR million 861 839 971 1,286 1,219 1,101 1,143 1,310 1,946 2,915
Profit after tax EUR million 237 324 725 747 752 811 871 824 1,343 1,692
Share price (year-end price)1EUR 75.16 61.20 59.59 160.00 191.00 225.00 220.15 308.00 540.00 625.00
Compensatory payment EUR 0.77 0.77 1.20 1.30 1.30 1.05 1.05 1.15 1.25 X2
Added value EUR million 3,039 3,198 3,590 3,892 4,000 4,287 4,585 4,801 6,156 6,634
Capital investments EUR million 1,620 1,516 2,378 2,084 2,342 2,047 2,056 1,708 1,925 2,115
Cash flow from
operating activities EUR million 1,213 1,163 2,058 2,393 2,440 2,786 2,690 3,252 4,428 4,876
Non-current assets EUR million 3,126 3,679 7,039 7,685 8,308 8,588 8,970 8,597 8,285 8,325
Current assets EUR million 3,359 3,024 3,219 3,437 4,342 5,475 5,934 7,515 10,625 14,253
Equity EUR million 1,231 1,441 3,749 4,222 4,761 5,487 5,828 6,104 7,265 8,355
Liabilities EUR million 5,254 5,262 6,509 6,900 7,889 8,576 9,076 10,008 11,645 14,223
Balance sheet total EUR million 6,485 6,703 10,258 11,122 12,650 14,063 14,904 16,112 18,910 22,578
1Year-end price on Munich Stock Exchange.
2In accordance with the resolution to be passed by the Annual General Meeting of Volkswagen AG on April 24, 2008.