Audi 2007 Annual Report Download - page 154
Download and view the complete annual report
Please find page 154 of the 2007 Audi annual report below. You can navigate through the pages in the report by either clicking on the pages listed below, or by using the keyword search tool below to find specific information within the annual report.-
 1
1 -
2
-
3
-
4
-
5
-
6
-
7
-
8
-
9
-
10
-
11
-
12
-
13
-
14
-
15
-
16
-
17
-
18
-
19
-
20
-
21
-
22
-
23
-
24
-
25
-
26
-
27
-
28
-
29
-
30
-
31
-
32
-
33
-
34
-
35
-
36
-
37
-
38
-
39
-
40
-
41
-
42
-
43
-
44
-
45
-
46
-
47
-
48
-
49
-
50
-
51
-
52
-
53
-
54
-
55
-
56
-
57
-
58
-
59
-
60
-
61
-
62
-
63
-
64
-
65
-
66
-
67
-
68
-
69
-
70
-
71
-
72
-
73
-
74
-
75
-
76
-
77
-
78
-
79
-
80
-
81
-
82
-
83
-
84
-
85
-
86
-
87
-
88
-
89
-
90
-
91
-
92
-
93
-
94
-
95
-
96
-
97
-
98
-
99
-
100
-
101
-
102
-
103
-
104
-
105
-
106
-
107
-
108
-
109
-
110
-
111
-
112
-
113
-
114
-
115
-
116
-
117
-
118
-
119
-
120
-
121
-
122
-
123
-
124
-
125
-
126
-
127
-
128
-
129
-
130
-
131
-
132
-
133
-
134
-
135
-
136
-
137
-
138
-
139
-
140
-
141
-
142
-
143
-
 144
144 -
 145
145 -
 146
146 -
 147
147 -
 148
148 -
 149
149 -
 150
150 -
 151
151 -
 152
152 -
 153
153 -
 154
154 -
 155
155 -
 156
156 -
 157
157 -
 158
158 -
 159
159 -
 160
160 -
 161
161 -
 162
162 -
 163
163 -
 164
164 -
165
-
166
-
167
-
168
-
169
-
170
-
171
-
172
-
173
-
174
-
175
-
176
-
177
-
178
-
179
-
180
-
181
-
182
-
183
-
184
-
185
-
186
-
187
-
188
-
189
-
190
-
191
-
192
-
193
-
194
-
195
-
196
-
197
-
198
-
199
-
200
-
201
-
202
-
203
-
204
-
205
-
206
-
207
-
208
-
209
-
210
-
211
-
212
-
213
-
214
-
215
-
216
-
217
-
218
-
219
-
220
-
221
-
222
-
223
-
224
-
225
-
226
-
227
-
228
-
229
-
230
-
231
-
232
-
233
-
234
-
235
-
236
-
237
-
238
-
239
 |
 |

151
The economy in Western Europe maintained the steady progress of the previous year.
The economy in the euro zone was thus able to grow by 2.6 (2.8) percent. Its development
was driven primarily by corporate investment and consumer spending, which benefited
from the continuing improvement in the labor market. The UK once again enjoyed stable
economic growth of 3.1 (2.9) percent.
The German economy remained buoyant, if slightly less so than the year before. Eco-
nomic growth was, however, down year on year at 2.5 (2.9) percent. The mainstays of the
economy were corporate investment and exports which, despite the strength of the euro,
reached a new record level. The sharp rise in energy prices and in particular the VAT rate
hike at the start of 2007 impeded economic progress. Consumer spending was down mark-
edly as a result, especially during the first few months of the year. Bolstered by the rise in
employment, consumer spending recovered somewhat as the year progressed, but did not
quite reach the previous year’s level.
The national economies in Central and Eastern Europe enjoyed continuing vigorous
growth in 2007. In Russia, gross domestic product rose by 7.8 (6.7) percent. Exports bene-
fited from the sharp rise in energy and raw materials prices during the course of the year.
Economic growth in Latin American countries was again strong. The principal factors
here were the sharp rise in world market prices for raw materials and food, which boosted
the value of exports from this region.
The emerging countries of Asia continued to experience dynamic economic growth. The
pulse rate of the economy rose yet again in China. The growth rate for gross domestic prod-
uct, for example, was up slightly over the previous year’s high figure at 11.4 (11.1) percent.
The Indian economy, too, maintained a strong rate of expansion, growing by 8.8 (9.4) per-
cent. In contrast, Japan’s economic progress remained moderate with GDP growth reaching
1.9 (2.4) percent.
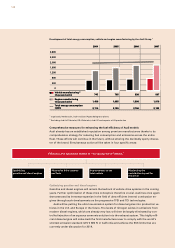
International car market
Global demand for cars in 2007 was supported to a considerable extent by sustained strong
economic growth in emerging countries. Economic dynamism in Asia, Latin America and
Central and Eastern Europe was the main factor behind the 4.2 percent rise in vehicle sales
worldwide to 58.4 million passenger cars. By contrast, the markets in the U.S. and Japan
contracted. The overall market for passenger cars in Western Europe reached only the level
seen the year before, due in particular to the sharp decrease in new registrations in Ger-
many.
Disregarding the German market, the car market in Western Europe exhibited an upward
trend in 2007. Total new registrations were up 3.1 percent year on year, at 11.7 million pas-
senger cars. Prompted by the payment of a disposal bonus for end-of-life vehicles, which
favored the compact car segment in particular, the Italian car market made distinctly posi-
tive progress, posting growth of 6.8 percent. Of the remaining key high-volume markets, the
UK and France reported growth of 2.5 and 3.2 percent respectively, while 1.2 percent fewer
new vehicles were registered in Spain.
Economic growth in the countries of Central and Eastern Europe gained further momen-
tum by comparison with 2006, with new registrations rising by 30.2 percent to a total of 4.2
million vehicles. In Russia, the already booming car market exhibited especially strong
growth in response to the economic upturn, increasing by 37.5 percent to 2.3 million pas-
senger cars in the period under review.
In the United States, the market remained tight due to the intensive use of sales incen-
tives. The ongoing real estate crisis and high fuel prices had a negative impact on vehicle
sales. With 16.1 million registrations of new passenger cars, the car market overall showed a
year-on-year decrease of 2.5 percent.