Asus 2007 Annual Report Download - page 92
Download and view the complete annual report
Please find page 92 of the 2007 Asus annual report below. You can navigate through the pages in the report by either clicking on the pages listed below, or by using the keyword search tool below to find specific information within the annual report.
88
A
SUSTEK COMPUTER INC.
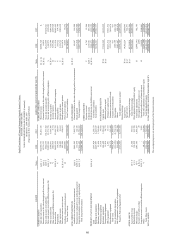
NON-CONSOLIDATED STATEMENTS OF
CASH FLOWS
(Unaudited)
(Expressed in New Taiwan Thousand Dollars)
2008 2007 2008 2007
CASH FLOWS FROM OPERATING ACTIVITIES: CASH FLOWS FROM INVESTING ACTIVITIES:
Net income $7,229,921 $6,731,358
In
crease
in certificate of deposit-restricted-current
(1,850,000)
-
Adjustments to reconcile net income to net cash Purchase of investments (310,494) (2,428,229)
provided by
/(used in)
operating activities:
Decrease in refundable deposits
129,512
1,643
Effects of changes in exchange rate for deposit in foreign currency (30,320) 78,141 Acquisition of property, plant and equipment (97,283) (128,604)
Depreciation 52,916 162,265
Proceeds from disposal of property, plant and equipment
919
37,692
Amortization 161,356 161,795
Increase in other assets
Purchase of
deferred charges
(102,287)
(150,688)
Depreciation from assets held for lease 706 1,014 Proceeds from disposal of deferred charges 157 419
Gain on disposal of
assets
(685)
(4,640)
In
crease in other assets
(77,392)
(33,849)
Loss on disposal of
assets
5,778
3,641
Cash transferred to spun-off subsidiaries
(2,000,000)
-
Property, plant and equipment transferred to other accounts
336
423
Net cash
used in
investing activities
(4,306,868)
(2,701,616)
Loss on obsolescence of property, plant and equipment
6,068
785
Investment income under equity method (2,622,891) (3,650,418) CASH FLOWS FROM FINANCING ACTIVITIES:
(Gain)/Loss on foreign exchange of bonds payable
(176,949)
96,600
Increase
in short-term loans
4,804,720
-
Amortization of discount and premium on bonds
58,670
57,792
Decrease
in deposits received
(11,920)
(100)
(Gain)/Loss on financial liabilities evaluated
(1,199)
21,600
Net cash provided by/(used in) financing activities
4,792,800
(100)
Amortization of deferred issuing cost of bonds 1,076 2,345
Changes in operating assets and liabilities: Effects of changes in exchange rate 30,320 (78,141)
(Increase)/Decrease in financial assets at fair value through profit or loss-current (8,462,156) 4,218,719
(Increase)/Decrease in notes and accounts receivable-net 53,019,166 (21,567,070) NET INCREASE/(DECREASE) IN CASH AND CASH EQUIVALENTS 3,606,557 (7,390,508)
(Increase)/Decrease in notes and accounts receivable-affiliated companies-net (8,133,928) (1,418,878)
CASH AND CASH EQUIVALENTS, BEGINNING OF THE
PERIOD
9,174,219
10,791,836
(Increase)/Decrease in other receivable
s-net
(719,057)
(1,412,741)
CASH AND CASH EQUIVALENTS, END OF THE
PERIOD
$12,780,776
$3,401,328
(Increase)/Decrease in other receivable
s-affiliated companies-net
(1,940,708)
11,688
(Increase)/Decrease in inventories-net 2,791,501 18,646,206
SUPPLEMENTAL DISCLOSURES OF CASH FLOWS
INFORMATION:
(Increase)/Decrease in prepayments 14,489 32,285
Cash paid during the
period
for:
(Increase)/Decrease in other current assets (2,957) (83,612)
(Increase)/Decrease in accounts receivable-overdue
-
4
Interest
$1,979
$4
(Increase)/Decrease in long-term accounts receivable-affiliated companies 4,998 444
(Increase)/Decrease in deferred income tax assets-current
(180,026)
(180,592)
Income tax
$14,856
$11,468
Increase/(Decrease)
in deferred income tax liabilities-noncurrent
215,640
420,600
Increase/
(
Decrease
)
in financial
liabilities
at fair value through profit or loss-current
64,019
-
Increase/(Decrease) in notes and accounts payable (31,351,191) (1,758,022) INVESTING AND FINANCING ACTIVITIES PARTIALLY AFFECTED CASH FLOWS:
Increase/(Decrease) in accounts payable-affiliated companies 605,303 (7,652,140) Items affected by spin-off of subsidiaries
Increase/(Decrease) in income tax payable
2,131,277
1,091,150
Non-cash assets transferred to spun-off subsidiaries
$111,851,499
$-
Increase/(Decrease) in accrued expenses (2,765,335) (541,602) Liabilities transferred to spun-off subsidiaries (31,851,499) -
Increase/(Decrease) in
accrued expenses-affiliated companies
(6,160,372)
1,711,496
Acquisition of long-term equity investments from spun-off subsidiaries
(82,000,000)
-
Increase/(Decrease) in other payables
(260,841)
(94,887)
Cash transferred to spun-off subsidiaries
($2,000,000)
$-
Increase/(Decrease) in receipts in advance (78,465) 437,888
Increase/(Decrease) in other current liabilities (17,218) (15,253) INVESTING AND FINANCING ACTIVITIES NOT AFFECTING CASH FLOWS:
(Increase)/Decrease in compensating interest receivable
(6,960)
(15,857)
Increase/(Decrease) in deferred credits
(361,657)
(103,178)
Bonds payable converted to capital stock
$233,617
$358,475
Net cash provided by/(used in) operating activities
3,090,305
(4,610,651)
Bonds payable-current portion
$2,614,474
$-
English Translations of Financial Statements Originally Issued in Chinese
FOR THE THREE-MONTH PERIODS ENDED MARCH 31, 2008 AND 2007
The accompanying notes are an integral part of the financial statements.
4


