Asus 2007 Annual Report Download - page 91
Download and view the complete annual report
Please find page 91 of the 2007 Asus annual report below. You can navigate through the pages in the report by either clicking on the pages listed below, or by using the keyword search tool below to find specific information within the annual report.-
 1
1 -
2
-
3
-
4
-
5
-
6
-
7
-
8
-
9
-
10
-
11
-
12
-
13
-
14
-
15
-
16
-
17
-
18
-
19
-
20
-
21
-
22
-
23
-
24
-
25
-
26
-
27
-
28
-
29
-
30
-
31
-
32
-
33
-
34
-
35
-
36
-
37
-
38
-
39
-
40
-
41
-
42
-
43
-
44
-
45
-
46
-
47
-
48
-
49
-
50
-
51
-
52
-
53
-
54
-
55
-
56
-
57
-
58
-
59
-
60
-
61
-
62
-
63
-
64
-
65
-
66
-
67
-
68
-
69
-
70
-
71
-
72
-
73
-
74
-
75
-
76
-
77
-
78
-
79
-
80
-
 81
81 -
 82
82 -
 83
83 -
 84
84 -
 85
85 -
 86
86 -
 87
87 -
 88
88 -
 89
89 -
 90
90 -
 91
91 -
 92
92 -
 93
93 -
 94
94 -
 95
95 -
 96
96 -
 97
97 -
 98
98 -
 99
99 -
 100
100 -
 101
101 -
102
-
103
-
104
-
105
-
106
-
107
-
108
-
109
-
110
-
111
-
112
-
113
-
114
-
115
-
116
-
117
-
118
-
119
-
120
-
121
-
122
-
123
-
124
-
125
-
126
-
127
-
128
-
129
-
130
-
131
-
132
-
133
-
134
-
135
-
136
-
137
-
138
-
139
-
140
-
141
-
142
-
143
-
144
-
145
-
146
-
147
-
148
-
149
-
150
-
151
-
152
-
153
-
154
-
155
-
156
-
157
-
158
-
159
-
160
-
161
-
162
-
163
-
164
-
165
-
166
-
167
-
168
-
169
-
170
-
171
-
172
-
173
-
174
-
175
-
176
-
177
 |
 |

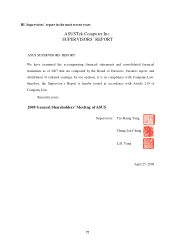
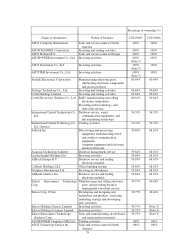
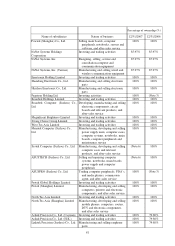
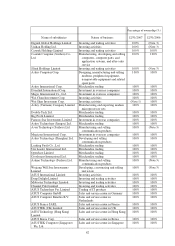
87
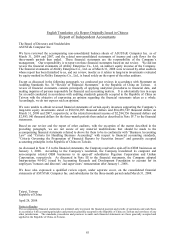
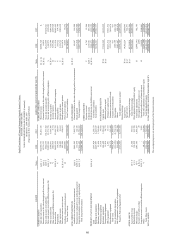
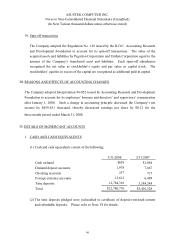
ASUSTEK COMPUTER INC.
FOR THE THREE-MONTH PERIODS ENDED MARCH 31, 2008 AND 2007
(Expressed in New Taiwan Thousand Dollars except for Earnings Per Share)
Notes 2008 2007
NET SALES II, V $77,272,786 $182,939,916
COST OF SALES IV.18, V (67,708,637) (173,739,688)
GROSS PROFIT 9,564,149 9,200,228
LESS: UNREALIZED GROSS PROFIT II (946,714) (786,940)
ADD: REALIZED GROSS PROFIT II 1,308,371 890,117
REALIZED GROSS PROFIT 9,925,806 9,303,405
OPERATING EXPENSES IV.18, V (4,709,950) (5,207,659)
OPERATING INCOME 5,215,856 4,095,746
NON-OPERATING INCOMES AND GAINS
Interest income 149,118 107,546
Investment income under equity method II, IV.7 2,622,891 3,650,418
Gain on disposal of assets II, V 685 4,640
Gain on disposal of investments II 14,931 15,293
Gain on reversal of bad debts II 1,019,219 -
Gain on financial assets evaluated II 4,651 -
Others V 1,171,218 338,413
Total 4,982,713 4,116,310
NON-OPERATING EXPENSES AND LOSSES
Interest expense 70,527 59,426
Loss on disposal of assets II 5,778 3,641
Loss on foreign exchange II 582,035 60,158
Loss on financial assets evaluated II - 8,411
Loss on financial liabilities evaluated II 62,820 21,600
Others V 65,741 24,576
Total 786,901 177,812
INCOME BEFORE INCOME TAX 9,411,668 8,034,244
INCOME TAX EXPENSE II, IV.19 (2,181,747) (1,302,886)
NET INCOME $7,229,921 $6,731,358
EARNINGS PER SHARE II, IV.20
Primary Earnings Per Share
Income before income tax $2.52 $2.20
Net income $1.94 $1.84
Fully Diluted Earnings Per Share
Income before income tax $2.38 $2.12
Net income $1.83 $1.78
English Translations of Financial Statements Originally Issued in Chinese
The accompanying notes are an integral part of the financial statements.
NON-CONSOLIDATED STATEMENTS OF INCOME (Unaudited)
3