Asus 2007 Annual Report Download - page 138
Download and view the complete annual report
Please find page 138 of the 2007 Asus annual report below. You can navigate through the pages in the report by either clicking on the pages listed below, or by using the keyword search tool below to find specific information within the annual report.-
 1
1 -
2
-
3
-
4
-
5
-
6
-
7
-
8
-
9
-
10
-
11
-
12
-
13
-
14
-
15
-
16
-
17
-
18
-
19
-
20
-
21
-
22
-
23
-
24
-
25
-
26
-
27
-
28
-
29
-
30
-
31
-
32
-
33
-
34
-
35
-
36
-
37
-
38
-
39
-
40
-
41
-
42
-
43
-
44
-
45
-
46
-
47
-
48
-
49
-
50
-
51
-
52
-
53
-
54
-
55
-
56
-
57
-
58
-
59
-
60
-
61
-
62
-
63
-
64
-
65
-
66
-
67
-
68
-
69
-
70
-
71
-
72
-
73
-
74
-
75
-
76
-
77
-
78
-
79
-
80
-
81
-
82
-
83
-
84
-
85
-
86
-
87
-
88
-
89
-
90
-
91
-
92
-
93
-
94
-
95
-
96
-
97
-
98
-
99
-
100
-
101
-
102
-
103
-
104
-
105
-
106
-
107
-
108
-
109
-
110
-
111
-
112
-
113
-
114
-
115
-
116
-
117
-
118
-
119
-
120
-
121
-
122
-
123
-
124
-
125
-
126
-
127
-
 128
128 -
 129
129 -
 130
130 -
 131
131 -
 132
132 -
 133
133 -
 134
134 -
 135
135 -
 136
136 -
 137
137 -
 138
138 -
 139
139 -
 140
140 -
 141
141 -
 142
142 -
 143
143 -
 144
144 -
 145
145 -
 146
146 -
 147
147 -
 148
148 -
149
-
150
-
151
-
152
-
153
-
154
-
155
-
156
-
157
-
158
-
159
-
160
-
161
-
162
-
163
-
164
-
165
-
166
-
167
-
168
-
169
-
170
-
171
-
172
-
173
-
174
-
175
-
176
-
177
 |
 |

134
134
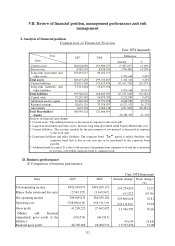
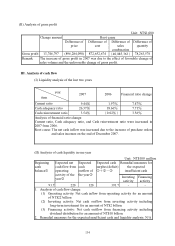
(II)Analysisofgrossprofit
Unit: NT$1,000
Rootcause
Changeamount
Differenceof
price
Differenceof
cost
Differenceof
sales
combination
Differenceof
quantity
Grossprofit 13,746,797 (896,284,090) 872,652,674 40,885,36378,263,576
Remark Theincreaseofgrossprofitin2007wasduetotheeffectoffavorablechangeo
f
salesvolumeandtheunfavorablechangeofgrossprofit.
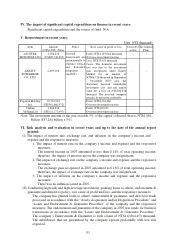
III.Analysisofcashflow
(I)Liquidityanalysisofthelasttwoyears
2007 2006 Financialratiochange
Currentratio 9.44 1.977.47
Cashadequacyratio 26.37 18.667.71
Cashreinvestmentratio 3.54 0.02 3.56
Analysisoffinancialratiochange:
Current ratio, Cash adequacy ratio, and Cash reinvestment ratio were increased in
2007from2006.
Rootcause:Thenetcashinflowwasincreasedduetotheincreaseofpurchaseorders
andsalesincomesontheendofDecember2007.
(II)Analysisofcashliquidityinoneyear
Unit: NT$100 million
Remedialmeasuresfor
theexpected
insufficientcash
Beginning
cash
balance
Expectednet
cashflowfrom
operating
activityofthe
year
Expected
cash
outflowof
theyear
Expectedcash
surplus(deficit)
Investing
activity
Financing
activity
91.7 220 120 191.7 - -
1. Analysisofcashflowchange:
(1) Operatingactivity:Netcashinflow fromoperatingactivityforanamount
ofNT$22billion
(2) Investing activity: Net cash outflow from investing activity including
long-terminvestmentforanamountofNT$2billion
(3) Financing activity: Net cash outflow from financing activity including
dividenddistributionforanamountofNT$10billion
2. Remedialmeasuresfortheexpectedinsufficientcashandliquidityanalysis:N/A
year
item