Asus 2007 Annual Report Download - page 90
Download and view the complete annual report
Please find page 90 of the 2007 Asus annual report below. You can navigate through the pages in the report by either clicking on the pages listed below, or by using the keyword search tool below to find specific information within the annual report.-
 1
1 -
2
-
3
-
4
-
5
-
6
-
7
-
8
-
9
-
10
-
11
-
12
-
13
-
14
-
15
-
16
-
17
-
18
-
19
-
20
-
21
-
22
-
23
-
24
-
25
-
26
-
27
-
28
-
29
-
30
-
31
-
32
-
33
-
34
-
35
-
36
-
37
-
38
-
39
-
40
-
41
-
42
-
43
-
44
-
45
-
46
-
47
-
48
-
49
-
50
-
51
-
52
-
53
-
54
-
55
-
56
-
57
-
58
-
59
-
60
-
61
-
62
-
63
-
64
-
65
-
66
-
67
-
68
-
69
-
70
-
71
-
72
-
73
-
74
-
75
-
76
-
77
-
78
-
79
-
 80
80 -
 81
81 -
 82
82 -
 83
83 -
 84
84 -
 85
85 -
 86
86 -
 87
87 -
 88
88 -
 89
89 -
 90
90 -
 91
91 -
 92
92 -
 93
93 -
 94
94 -
 95
95 -
 96
96 -
 97
97 -
 98
98 -
 99
99 -
 100
100 -
101
-
102
-
103
-
104
-
105
-
106
-
107
-
108
-
109
-
110
-
111
-
112
-
113
-
114
-
115
-
116
-
117
-
118
-
119
-
120
-
121
-
122
-
123
-
124
-
125
-
126
-
127
-
128
-
129
-
130
-
131
-
132
-
133
-
134
-
135
-
136
-
137
-
138
-
139
-
140
-
141
-
142
-
143
-
144
-
145
-
146
-
147
-
148
-
149
-
150
-
151
-
152
-
153
-
154
-
155
-
156
-
157
-
158
-
159
-
160
-
161
-
162
-
163
-
164
-
165
-
166
-
167
-
168
-
169
-
170
-
171
-
172
-
173
-
174
-
175
-
176
-
177
 |
 |
86
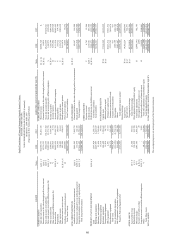
ASSETS Notes 2008 2007 LIABILITIES AND STOCKHOLDERS' EQUITY Notes 2008 2007
CURRENT ASSETS CURRENT LIABILITIES
Cash and cash equivalents
II,
IV.1
, V
$12,780,776
$3,401,328
Short-term loans
IV.1
1, VI
$4,804,720
$-
Financial assets at fair value through profit or loss-current
II,
IV.2
15,719,325
-
Financial liabilities at fair value through profit or loss-current
I
I, IV.12
64,019
-
Notes and accounts receivable-Net
II,
IV.3
8,844,078
102,517,302
Notes and accounts payable
28,212,559
107,472,021
Notes and accounts receivable-affiliated companies-Net
II,
IV.3
, V
53,881,046
22,571,778
Notes and accounts payable -affiliated companies
V
1,442,972
1,355,003
Other receivable
s-Net
I
I
5,788,691
3,019,386
Income tax payable
II,
IV.
19
7,926,749
4,649,930
Other receivable
s-affiliated companies-Net
V
1,940,708
8,774
Accrued expenses
II
5,691,804
4,659,620
Inventories-Net
II
, IV.4, V
18,655,818
53,981,755
Accrued expenses-affiliated companies
V
6,111,214
18,063,695
Prepayments V 106,385 130,097 Other payables V 510,722 374,766
Other current assets 104,820 83,612 Receipts in advance V 2,333,733 2,940,620
Deferred income tax assets-current
II,
IV.
19, V
845,548
638,612
Bonds payable-current portion
I
I,
IV.1
3
2,614,474
-
C
ertificate of deposit-restricted-current
V
I
1,850,000
-
Other current liabilities
35,655
75,074
Total Current Assets 120,517,195 186,352,644 Total Current Liabilities 59,748,621 139,590,729
LONG-TERM INVESTMENTS LONG-TERM DEBT
II,
IV.1
3
Available-for-sale financial assets-noncurrent
II,
IV
.5
5,446,945
7,492,379
Financial liabilities at fair value through profit or loss-noncurrent
89,947
169,200
Financial assets evaluated by cost method-noncurrent
II,
IV
.6, V
130,678
114,328
Bonds payable
11,137,818
17,239,580
Long-term investments evaluated by equity method
II,
IV
.7, V
107,466,683
95,519,107
Total Long-term Debt
11,227,765
17,408,780
Total Long-term Investments 113,044,306 103,125,814
OTHER LIABILITIES
Deposits received V 4,783 15,268
Deferred credits
II,
IV.
7
1,169,001
887,808
PROPERTY, PLANT AND EQUIPMENT
II,
IV
.8, V
Deferred income tax liabilities-noncurrent
II,
IV.
19
2,014,271
1,939,352
Land
1,019,424
3,238,133
Total Other Liabilities
3,188,055
2,842,428
Buildings and equipment
2,429,897
4,243,647
Total Liabilities
74,164,441
159,841,937
Machinery and equipment 23,628 1,765,809
Warehousing equipment 16,518 34,932 STOCKHOLDERS' EQUITY
Instrument equipment
684,680
1,356,643
Capital stock
IV.1
4
37,318,885
34,120,829
Transportation equipment
16,014
38,772
Additional paid-in capital
IV.1
5
Office equipment
4,091
17,315
Premium on capital stock
20,213,812
17,813,532
Miscellaneous equipment
228,172
513,442
Premium on conversion of bonds
6,310,562
3,419,076
Total Costs 4,422,424 11,208,693 Treasury stock transactions 617 617
Less: Accumulated depreciation
(916,352)
(2,774,123)
Stock option
1,020,109
1,020,705
Add: Prepayments on purchase of equipment
210,685
242,780
Others
2,053,487
805,876
Property, Plant and Equipment-Net
3,716,757
8,677,350
Total additional paid-in capital
29,598,587
23,059,806
Retained earnings
Legal reserve
IV.1
6
14,502,229
12,580,095
Special reserve
IV.1
7
-
614,571
OTHER ASSETS Unappropriated earnings
IV.1
7
85,334,014
66,895,289
Assets held for lease
IV
.9, V
43,588
197,921
Total retained earnings
99,836,243
80,089,955
Refundable deposits
V,
VI
124,828
265,708
Other adjustments of stockholders' equity
Deferred charges
II
, V
1,083,585
1,206,287
Translation adjustments
II
(2,448,191)
782,783
Accounts receivable-overdue
II,
IV
.
1
0
-
20
Unrecognized loss on pension cost
(289)
-
Long-term accounts receivable-affiliated companies
II,
IV.3, V
-
2,021
Unrealized profit/(loss) of financial assets
I
I
154,920
2,046,441
Others V 94,337 113,986 Total other adjustments of stockholders' equity (2,293,560) 2,829,224
Total Other Assets 1,346,338 1,785,943 Total Stockholders' Equity 164,460,155 140,099,814
TOTAL ASSETS
$238,624,596
$299,941,751
TOTAL LIABILITIES AND STOCKHOLDERS' EQUITY
$238,624,596
$299,941,751
The accompanying notes are an integral part of the financial statements.
(Expressed in New Taiwan Thousand Dollars)
English Translations of Financial Statements Originally Issued in Chinese
ASUSTEK COMPUTER INC.
NON-CONSOLIDATED BALANCE SHEETS (Unaudited)
MARCH 31, 2008 AND 2007
2