Air New Zealand 2013 Annual Report Download - page 8
Download and view the complete annual report
Please find page 8 of the 2013 Air New Zealand annual report below. You can navigate through the pages in the report by either clicking on the pages listed below, or by using the keyword search tool below to find specific information within the annual report.-
 1
1 -
 2
2 -
 3
3 -
 4
4 -
 5
5 -
 6
6 -
 7
7 -
 8
8 -
 9
9 -
 10
10 -
 11
11 -
 12
12 -
 13
13 -
 14
14 -
 15
15 -
 16
16 -
 17
17 -
 18
18 -
 19
19 -
20
-
21
-
22
-
23
-
24
-
25
-
26
-
27
-
28
-
29
-
30
-
31
-
32
-
33
-
34
-
35
-
36
-
37
-
38
-
39
-
40
-
41
-
42
-
43
-
44
-
45
-
46
-
47
-
48
-
49
-
50
-
51
-
52
-
53
-
54
-
55
-
56
-
57
-
58
-
59
-
60
-
61
-
62
-
63
-
64
-
65
-
66
-
67
-
68
-
69
-
70
-
71
-
72
-
73
-
74
-
75
-
76
-
77
-
78
-
79
-
80
 |
 |

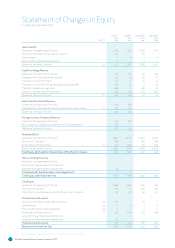
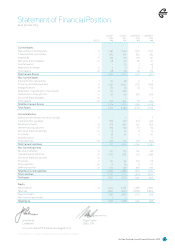
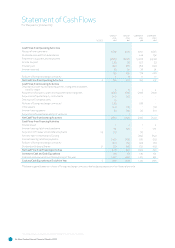
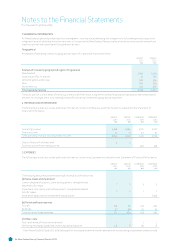
The accompanying accounting policies and notes form part of these financial statements.
Air New Zealand Annual Financial Results
6
NOTES
GROUP
M
GROUP
M
COMPANY
M
COMPANY
M
Cash Flows from Operating Activities
Receipts from customers 4,657 4,515 4,021 3,826
Dividends received from subsidiaries - - 248 198
Payments to suppliers and employees (3,841) (3,997) (3,419) (3,543)
Income tax paid (28) (5) (27) (5)
Interest paid
(84) (87) (83) (90)
Interest received
35 29 38 34
739 455 778 420
Rollover of foreign exchange contracts * 11 17 11 17
Net Cash Flow from Operating Activities 6 750 472 789 437
Cash Flows from Investing Activities
Disposal of property, plant and equipment, intangibles and assets
held for resale
9
8
7
4
Acquisition of property, plant and equipment and intangibles
(382) (610) (209) (553)
Acquisition of quoted equity instruments (46) (30) - -
Distribution from associates 15 - - -
Rollover of foreign exchange contracts * (28) - (28) -
Other assets (44) (13) - (13)
Interest-bearing assets (4) (10) (4) (10)
Acquisition of subsidiaries and joint ventures
- 1 - -
Net Cash Flow from Investing Activities (480) (654) (234) (572)
Cash Flows from Financing Activities
Shares issued 1 2 1 2
Interest-bearing liabilities drawdowns 114 574 - 574
Acquisition of treasury stock (share buyback) 23 (11) - (11) -
Net decrease in related party funding - - (232) (152)
Interest-bearing liabilities payments (149) (165) (81) (63)
Rollover of foreign exchange contracts * (30) (19) (30) (19)
Dividend on Ordinary Shares 21 (72) (43) (72) (43)
Net Cash Flow from Financing Activities
(147) 349 (425) 299
Increase in Cash and Cash Equivalents 123 167 130 164
Cash and cash equivalents at the beginning of the year 1,027 860 1,015 851
Cash and Cash Equivalents at End of the Year 6 1,150 1,027 1,145 1,015
* Relates to gains/losses on rollover of foreign exchange contracts that hedge exposures in other financial periods.
Statement of Cash Flows
For the year to 30 June 2013