Air New Zealand 2013 Annual Report Download - page 27
Download and view the complete annual report
Please find page 27 of the 2013 Air New Zealand annual report below. You can navigate through the pages in the report by either clicking on the pages listed below, or by using the keyword search tool below to find specific information within the annual report.-
 1
1 -
2
-
3
-
4
-
5
-
6
-
7
-
8
-
9
-
10
-
11
-
12
-
13
-
14
-
15
-
16
-
 17
17 -
 18
18 -
 19
19 -
 20
20 -
 21
21 -
 22
22 -
 23
23 -
 24
24 -
 25
25 -
 26
26 -
 27
27 -
 28
28 -
 29
29 -
 30
30 -
 31
31 -
 32
32 -
 33
33 -
 34
34 -
 35
35 -
 36
36 -
 37
37 -
38
-
39
-
40
-
41
-
42
-
43
-
44
-
45
-
46
-
47
-
48
-
49
-
50
-
51
-
52
-
53
-
54
-
55
-
56
-
57
-
58
-
59
-
60
-
61
-
62
-
63
-
64
-
65
-
66
-
67
-
68
-
69
-
70
-
71
-
72
-
73
-
74
-
75
-
76
-
77
-
78
-
79
-
80
 |
 |

Air New Zealand Annual Financial Results 25
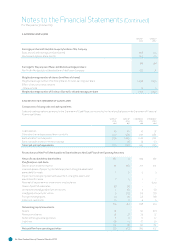
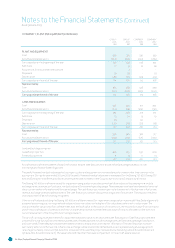
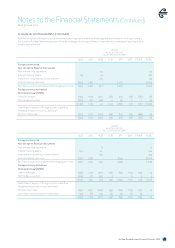
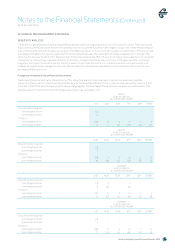
. INVESTMENTS IN OTHER ENTITIES CONTINUED
ASSOCIATES AND JOINT VENTURES
Significant associates and joint ventures comprise:
NAME RELATIONSHIP
%
OWNED PRINCIPAL ACTIVITY
COUNTRY OF
INCORPORATION
BALANCE
DATE
Christchurch Engine Centre (CEC) Associate 49 Engineering services New Zealand 31 December
Pacific Leisure Group Limited Joint venture 50 Wholesale travel distributor New Zealand 30 June
ASSOCIATE
GROUP
M
ASSOCIATE
GROUP
M
Carrying amount
Christchurch Engine Centre 45 59
45 59
The carrying amount for joint ventures for the year ended 30 June 2013 was Nil (30 June 2012: Nil).
ASSOCIATE
GROUP
M
ASSOCIATE
GROUP
M
Results of associates
Share of profit before taxation 5 6
Share of profit aer taxation of associates 5 6
JOINT
VENTURE
GROUP
M
JOINT
VENTURE
GROUP
M
ASSOCIATE
GROUP
M
ASSOCIATE
GROUP
M
Summarised financial information of associates and joint ventures - 100%:
Assets 12 10 139 151
Liabilities 10 9 47 39
Revenue 3 1 270 289
Expenses 2 1 260 277
Profit aer taxation 1 - 10 12
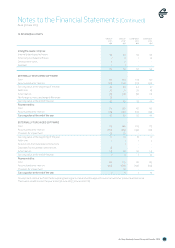
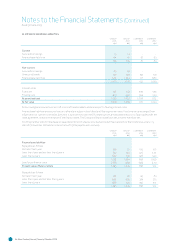
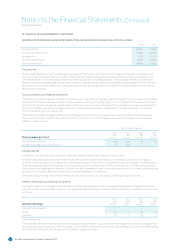
. REVENUE IN ADVANCE
GROUP
M
GROUP
M
COMPANY
M
COMPANY
M
Current
Transportation sales in advance 796 779 796 776
Loyalty programme
101 103 101 103
Other 21 20 13 14
918 902 910 893
Non-current
Loyalty programme
135 131 135 131
Other 5 4 5 3
140 135 140 134
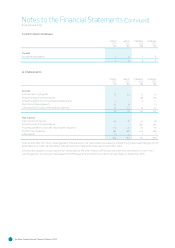
Notes to the Financial Statements (Continued)
As at 30 June 2013