Air New Zealand 2013 Annual Report Download - page 36
Download and view the complete annual report
Please find page 36 of the 2013 Air New Zealand annual report below. You can navigate through the pages in the report by either clicking on the pages listed below, or by using the keyword search tool below to find specific information within the annual report.-
 1
1 -
2
-
3
-
4
-
5
-
6
-
7
-
8
-
9
-
10
-
11
-
12
-
13
-
14
-
15
-
16
-
17
-
18
-
19
-
20
-
21
-
22
-
23
-
24
-
25
-
 26
26 -
 27
27 -
 28
28 -
 29
29 -
 30
30 -
 31
31 -
 32
32 -
 33
33 -
 34
34 -
 35
35 -
 36
36 -
 37
37 -
 38
38 -
 39
39 -
 40
40 -
 41
41 -
 42
42 -
 43
43 -
 44
44 -
 45
45 -
 46
46 -
47
-
48
-
49
-
50
-
51
-
52
-
53
-
54
-
55
-
56
-
57
-
58
-
59
-
60
-
61
-
62
-
63
-
64
-
65
-
66
-
67
-
68
-
69
-
70
-
71
-
72
-
73
-
74
-
75
-
76
-
77
-
78
-
79
-
80
 |
 |

Air New Zealand Annual Financial Results
34
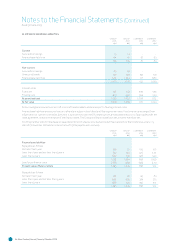
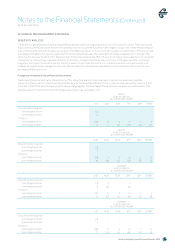
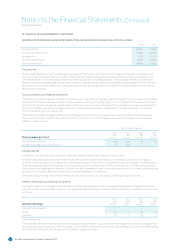
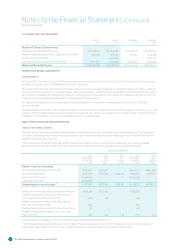
. FINANCIAL RISK MANAGEMENT CONTINUED
COMPANY
AS AT JUNE
STATEMENT
OF FINANCIAL
POSITION
M
CONTRACTUAL
CASH FLOWS
M
YEAR
M
YEARS
M
YEARS
M
YEARS
M
Bank overdra and short-term borrowings 1 1 1 - - -
Trade and other payables
347 347 347 - - -
Unsecured bonds 150 186 10 10 166 -
Finance lease obligations 858 956 105 107 318 426
Amounts owing to subsidiaries 539 539 483 - - 56
Total non-derivative liabilities 1,895 2,029 946 117 484 482
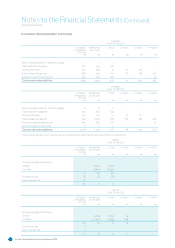
COMPANY
AS AT JUNE
STATEMENT
OF FINANCIAL
POSITION
M
CONTRACTUAL
CASH FLOWS
M
YEAR
M
YEARS
M
YEARS
M
YEARS
M
Bank overdra and short-term borrowings 6 6 6 - - -
Trade and other payables 332 332 332 - - -
Unsecured bonds
150 197 10 10 177 -
Finance lease obligations 972 1,099 106 108 336 549
Amounts owing to subsidiaries 803 803 706 - - 97
Amounts owing to associates 6 6 6 - - -
Total non-derivative liabilities 2,269 2,443 1,166 118 513 646
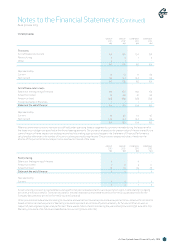
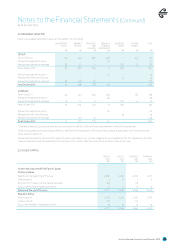
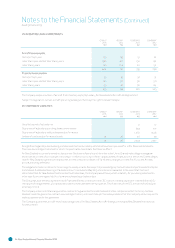
The following tables set out the contractual, undiscounted cash flows for derivative financial instruments:
GROUP
AS AT JUNE
STATEMENT
OF FINANCIAL
POSITION
M
CONTRACTUAL
CASH FLOWS
M
YEAR
M
YEARS
M
YEARS
M
YEARS
M
Foreign exchange derivatives:
- Inflow 2,047 2,047 - - -
- Outflow (1,964) (1,964) - - -
91 83 83 - - -
Fuel derivatives (1) (6) (6) - - -
Equity derivatives (5) - - - - -
85 77 77 - - -
GROUP
AS AT JUNE
STATEMENT
OF FINANCIAL
POSITION
M
CONTRACTUAL
CASH FLOWS
M
YEAR
M
YEARS
M
YEARS
M
YEARS
M
Foreign exchange derivatives:
- Inflow 2,083 2,009 74 - -
- Outflow
(2,064) (1,995) (69) - -
20 19 14 5 - -
Fuel derivatives 3 - - - - -
Equity derivatives 4 - - - - -
27 19 14 5 - -
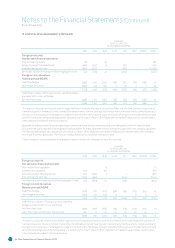
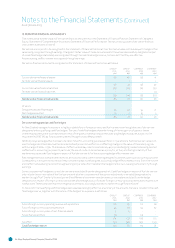
Notes to the Financial Statements (Continued)
As at 30 June 2013