Air New Zealand 2013 Annual Report Download - page 44
Download and view the complete annual report
Please find page 44 of the 2013 Air New Zealand annual report below. You can navigate through the pages in the report by either clicking on the pages listed below, or by using the keyword search tool below to find specific information within the annual report.-
 1
1 -
2
-
3
-
4
-
5
-
6
-
7
-
8
-
9
-
10
-
11
-
12
-
13
-
14
-
15
-
16
-
17
-
18
-
19
-
20
-
21
-
22
-
23
-
24
-
25
-
26
-
27
-
28
-
29
-
30
-
31
-
32
-
33
-
 34
34 -
 35
35 -
 36
36 -
 37
37 -
 38
38 -
 39
39 -
 40
40 -
 41
41 -
 42
42 -
 43
43 -
 44
44 -
 45
45 -
 46
46 -
 47
47 -
 48
48 -
 49
49 -
 50
50 -
 51
51 -
 52
52 -
 53
53 -
 54
54 -
55
-
56
-
57
-
58
-
59
-
60
-
61
-
62
-
63
-
64
-
65
-
66
-
67
-
68
-
69
-
70
-
71
-
72
-
73
-
74
-
75
-
76
-
77
-
78
-
79
-
80
 |
 |

Air New Zealand Annual Financial Results
42
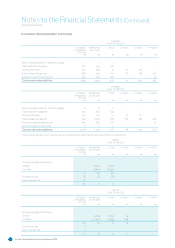
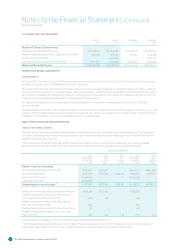
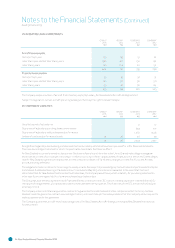
. ISSUED CAPITAL CONTINUED
The general principles underlying the Black Scholes option pricing model have been used to value these options using a Monte Carlo
simulation approach. The key inputs to this model for options granted in that year were as follows:
GROUP AND COMPANY
TRANCHE
TRANCHE
Weighted average share price (cents) 112 112
Expected volatility of share price (%) 30 30
Expected volatility of performance benchmark index (%) 15 20
Correlation of volatility indices 0.20 0.20
Contractual life (years) 4.0 6.0
Risk free rate (%) 2.90 3.30
Expected dividend yield 4.9 4.9
Discount to reflect negotiability restrictions (%) 20 25
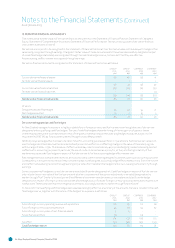
The exercise price has been modelled as a stochastic variable, using the volatility, correlation, dividend yield and risk free rate
assumptions detailed above.
The volatility and correlation estimates were derived from measuring these parameters using historical data over the preceding two
years for the first tranche and four years for the second tranche. The risk free rate was based on a four year zero coupon bond yield for the
first tranche and six year zero coupon bond yield for the second tranche implied from short to medium term yields for government bonds.
The expected life used in calculating the value of options was determined by analysis of the arition rates and early exercise behaviour of
staff in long term incentive programmes in similar large corporates.
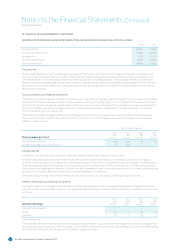
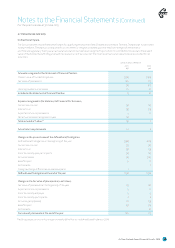
CEO Option Plan
On 21 September 2012, 8,607,519 options with a fair value of $1.1 million were issued to the former Chief Executive Officer under the CEO
Option Plan (16 September 2011: 6,708,075 options with a fair value of $1.1 million). Total options outstanding under the CEO Option Plan are
28,177,436 (30 June 2012: 19,569,917). As at 30 June 2013 the fair value of outstanding CEO options has been fully amortised (30 June 2012: the
unamortised fair value of outstanding CEO Option Plan options (measured at grant date) was $0.5 million).
The options issued in the current year may be exercised at any time aer the date of issue over a two year period (2012: one to three years
aer the date of issue) for the CEO Option Plan (subject to compliance with insider trading restrictions and the rules of the scheme).
Options issued in the current year were exercisable immediately. The exercise price was determined using a Black Scholes option pricing
model based on the Company share price over the 10 business days from 4 to 17 September 2012 adjusted for expected distributions in
September 2014. The exercise price in the prior year was set one year aer issue, and was based on the Company share price at the issue
date increased or decreased by the percentage movement in a specified index over the year and decreased by any distributions made by the
Company over the same period.
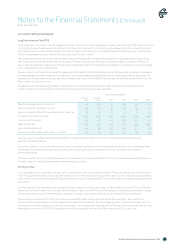
The general principles underlying the Black Scholes option pricing model have been used to value these options. In the 2009 to 2012 years the
option pricing model used a Monte Carlo simulation approach. A simplified approach has been applied in the 2013 year given the exercise price
was fixed at issue date. The key inputs to this model for options granted in that year were as follows:
GROUP AND COMPANY
Weighted average share price (cents) 112 111 129 124 114
Expected volatility of share price (%) 25 30 37 40 37
Expected volatility of performance benchmark index (%) - 17 17 17 15
Correlation of volatility indices - 0.40 0.45 0.50 0.45
Contractual life (years) 2.0 3.0 4.0 5.0 6.0
Risk free rate (%) 2.60 3.54 4.46 5.50 5.90
Expected dividend yield 3.35 5.0 5.4 5.2 7.5
Discount to reflect negotiability restrictions (%) 512.5 20 25 25
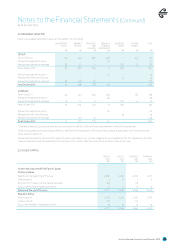
The exercise price has been modelled as a stochastic variable, using the volatility, correlation, dividend yield and risk free rate
assumptions detailed above.
The volatility and correlation estimates for the prior year were derived from measuring these parameters using historical data over the
preceding one to three years. The risk free rate was based on the two year zero coupon bond yield (2012: three year zero coupon bond
yield) implied from short to medium term yields for government bonds.
Notes to the Financial Statements (Continued)
As at 30 June 2013