Air New Zealand 2013 Annual Report Download - page 20
Download and view the complete annual report
Please find page 20 of the 2013 Air New Zealand annual report below. You can navigate through the pages in the report by either clicking on the pages listed below, or by using the keyword search tool below to find specific information within the annual report.-
 1
1 -
2
-
3
-
4
-
5
-
6
-
7
-
8
-
9
-
 10
10 -
 11
11 -
 12
12 -
 13
13 -
 14
14 -
 15
15 -
 16
16 -
 17
17 -
 18
18 -
 19
19 -
 20
20 -
 21
21 -
 22
22 -
 23
23 -
 24
24 -
 25
25 -
 26
26 -
 27
27 -
 28
28 -
 29
29 -
 30
30 -
31
-
32
-
33
-
34
-
35
-
36
-
37
-
38
-
39
-
40
-
41
-
42
-
43
-
44
-
45
-
46
-
47
-
48
-
49
-
50
-
51
-
52
-
53
-
54
-
55
-
56
-
57
-
58
-
59
-
60
-
61
-
62
-
63
-
64
-
65
-
66
-
67
-
68
-
69
-
70
-
71
-
72
-
73
-
74
-
75
-
76
-
77
-
78
-
79
-
80
 |
 |

Air New Zealand Annual Financial Results
18
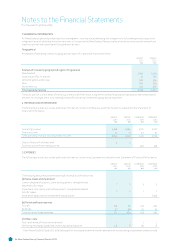
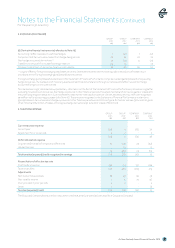
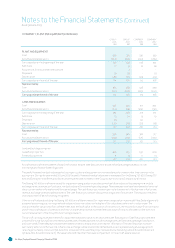
. EARNINGS PER SHARE
GROUP
GROUP
Earnings per share aributable to equity holders of the Company
Basic and diluted earnings per share (cents) 16.6 6.5
Diluted earnings per share (cents)
16.5 6.5
$M $M
Earnings for the purpose of basic and diluted earnings per share:
Net Profit Aributable to Shareholders of the Parent Company 182 71
Weighted average number of shares (in millions of shares)
Weighted average number of Ordinary Shares for basic earnings per share 1,096 1,096
Effect of dilutive ordinary shares:
- Share options 8 3
Weighted average number of Ordinary Shares for diluted earnings per share 1,104 1,099
. NOTES TO THE STATEMENT OF CASH FLOWS
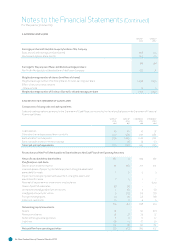
Composition of closing cash and cash equivalents
Cash and cash equivalents, as stated in the Statement of Cash Flows, are reconciled to the related balances in the Statement of Financial
Position as follows:
GROUP
M
GROUP
M
COMPANY
M
COMPANY
M
Cash balances 23 46 19 37
Other short term deposits and short term bills 1,127 983 1,127 984
Bank and short term deposits 1,150 1,029 1,146 1,021
Bank overdra and short term borrowings - (2) (1) (6)
Total cash and cash equivalents 1,150 1,027 1,145 1,015
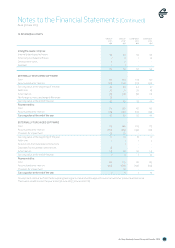
Reconciliation of Net Profit Aributable to Shareholders to Net Cash Flows from Operating Activities:
Net profit aributable to shareholders 182 71 349 287
Plus/(less) non-cash items:
Depreciation and amortisation 411 348 277 231
Loss on disposal of property, plant and equipment, intangible assets and
assets held for resale
7
6
5
3
Impairment on property, plant and equipment, intangible assets and
assets held for resale
7 5
1 7
Reversal of impairment on investments in subsidiaries - - - (129)
Share of profit of associates
(5) (6) - -
Unrealised losses/(gains)on fuel derivatives
2 (6) 2 (6)
Loss/(gain) on equity derivative
3 (13) (2) (13)
Foreign exchange gains
(1) (4) (2) (13)
Other non-cash items 13 13 8 6
619 414 638 373
Net working capital movements:
Assets
31 - 50 (10)
Revenue in advance 21 27 23 37
Deferred foreign exchange losses 11 17 11 17
Liabilities
68 14 67 20
131 58 151 64
Net cash flow from operating activities
750 472 789 437
Notes to the Financial Statements (Continued)
For the year to 30 June 2013