Air New Zealand 2013 Annual Report Download - page 54
Download and view the complete annual report
Please find page 54 of the 2013 Air New Zealand annual report below. You can navigate through the pages in the report by either clicking on the pages listed below, or by using the keyword search tool below to find specific information within the annual report.-
 1
1 -
2
-
3
-
4
-
5
-
6
-
7
-
8
-
9
-
10
-
11
-
12
-
13
-
14
-
15
-
16
-
17
-
18
-
19
-
20
-
21
-
22
-
23
-
24
-
25
-
26
-
27
-
28
-
29
-
30
-
31
-
32
-
33
-
34
-
35
-
36
-
37
-
38
-
39
-
40
-
41
-
42
-
43
-
 44
44 -
 45
45 -
 46
46 -
 47
47 -
 48
48 -
 49
49 -
 50
50 -
 51
51 -
 52
52 -
 53
53 -
 54
54 -
 55
55 -
 56
56 -
 57
57 -
 58
58 -
 59
59 -
 60
60 -
 61
61 -
 62
62 -
 63
63 -
 64
64 -
65
-
66
-
67
-
68
-
69
-
70
-
71
-
72
-
73
-
74
-
75
-
76
-
77
-
78
-
79
-
80
 |
 |

Air New Zealand Annual Financial Results
52
M
M
M
M
M
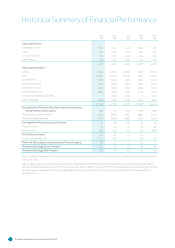
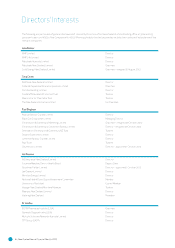
Operating Revenue
Passenger revenue 3,765 3,634 3,525 3,305 3,734
Cargo 301 298 278 255 374
Contract services 313 316 329 322 331
Other revenue 239 235 209 164 170
4,618 4,483 4,341 4,046 4,609
Operating Expenditure
Labour (1,069) (1,050) (1,034) (976) (1,019)
Fuel (1,204) (1,219) (1,084) (939) (1,687)
Maintenance (303) (303) (311) (326) (327)
Aircra operations (419) (390) (381) (369) (423)
Passenger services (222) (233) (242) (240) (275)
Sales and marketing (274) (270) (274) (261) (295)
Foreign exchange gains/(losses) 7 (68) (118) 6 366
Other expenses (236) (235) (234) (233) (261)
(3,720) (3,768) (3,678) (3,338) (3,921)
Earnings Before Finance Costs, Depreciation, Amortisation,
Rental Expenses and Taxation
898 715
663 708 688
Depreciation and amortisation (411) (348) (316) (294) (276)
Rental and lease expenses (177) (209) (238) (263) (334)
Earnings Before Finance Costs and Taxation 310 158 109 151 78
Finance income 37 31 36 43 98
Finance costs (91) (95) (72) (71) (169)
Profit Before Taxation 256 94 73 123 7
Taxation (expense)/credit (74) (23) 8 (41) 14
Net Profit Aributable to Shareholders of Parent Company 182 71 81 82 21
Normalised Earnings Before Taxation* 256 91 75 137 145
Normalised Earnings Aer Taxation* 182 69 82 92 118
Certain comparatives within the five year statistical review have been reclassified for comparative purposes, to ensure consistency with
the current year.
*Normalised Earnings represents Earnings stated in compliance with NZ IFRS (Statutory Earnings) aer excluding net gains and losses on
derivatives that hedge exposures in other financial periods. Normalised Earnings is a non-IFRS financial performance measure that matches
derivative gains or losses with the underlying hedged transaction, and represents the underlying performance of the business for the
relevant period.
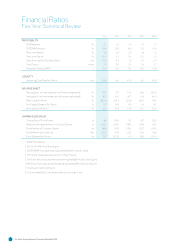
Historical Summary of Financial Performance