Air New Zealand 2013 Annual Report Download - page 24
Download and view the complete annual report
Please find page 24 of the 2013 Air New Zealand annual report below. You can navigate through the pages in the report by either clicking on the pages listed below, or by using the keyword search tool below to find specific information within the annual report.-
 1
1 -
2
-
3
-
4
-
5
-
6
-
7
-
8
-
9
-
10
-
11
-
12
-
13
-
 14
14 -
 15
15 -
 16
16 -
 17
17 -
 18
18 -
 19
19 -
 20
20 -
 21
21 -
 22
22 -
 23
23 -
 24
24 -
 25
25 -
 26
26 -
 27
27 -
 28
28 -
 29
29 -
 30
30 -
 31
31 -
 32
32 -
 33
33 -
 34
34 -
35
-
36
-
37
-
38
-
39
-
40
-
41
-
42
-
43
-
44
-
45
-
46
-
47
-
48
-
49
-
50
-
51
-
52
-
53
-
54
-
55
-
56
-
57
-
58
-
59
-
60
-
61
-
62
-
63
-
64
-
65
-
66
-
67
-
68
-
69
-
70
-
71
-
72
-
73
-
74
-
75
-
76
-
77
-
78
-
79
-
80
 |
 |

Air New Zealand Annual Financial Results
22
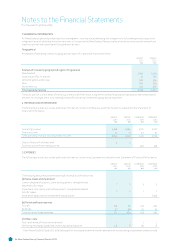
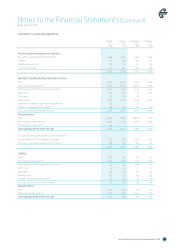
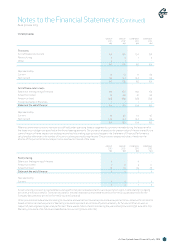
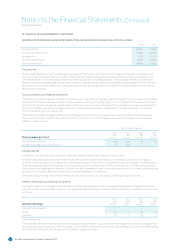
. PROPERTY, PLANT AND EQUIPMENT CONTINUED
GROUP
M
GROUP
M
COMPANY
M
COMPANY
M
PLANT AND EQUIPMENT
Cost 368 375 330 339
Accumulated depreciation (242) (253) (222) (235)
Carrying value at the beginning of the year 126 122 108 104
Additions 17 31 16 28
Acquisitions from business combinations - 2 - -
Disposals (1) (2) - (1)
Depreciation
(28) (27) (25) (23)
Carrying value at the end of the year 114 126 99 108
Represented by:
Cost 365 368 328 330
Accumulated depreciation (251) (242) (229) (222)
Carrying value at the end of the year
114 126 99 108
LAND AND BUILDINGS
Cost 346 326 317 302
Accumulated depreciation (114) (98) (104) (90)
Carrying value at the beginning of the year 232 228 213 212
Additions 13 24 13 19
Disposals (2) - (2) -
Depreciation (26) (20) (23) (18)
Carrying value at the end of the year 217 232 201 213
Represented by:
Cost 350 346 322 317
Accumulated depreciation (133) (114) (121) (104)
Carrying value at the end of the year 217 232 201 213
Land and buildings comprise:
Leasehold properties 206 219 190 200
Freehold properties 11 13 11 13
217 232 201 213
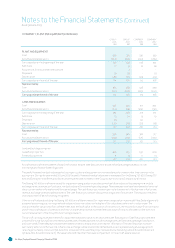
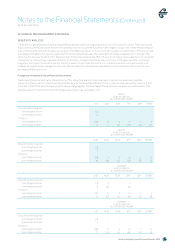
Aircra and aircra related assets of $1,916 million as at 30 June 2013 (30 June 2012: $1,923 million) are pledged as security over
borrowings and finance lease obligations.
The useful lives and residual values applied to property, plant and equipment are reviewed annually to ensure that they continue to be
appropriate. During the year ended 30 June 2013 the useful lives and residual values were reassessed for the Boeing 737-300, Boeing 767-
300 and Boeing 747-400 fleets and depreciation expense was increased in the Group by $27 million and Company by $6 million.
The Boeing 747-400 aircra were tested for impairment using a value in use discounted cash flow valuation. Key assumptions include
exchange rates, revenues, jet fuel costs, residual value and forecasted operating usage. These assumptions have been based on historical
data, current market information and forecasted usage. The cash flow projections are particularly sensitive to fluctuations in fuel prices,
revenue, exchange rates and sales proceeds. The cash flow projections are discounted using a rate of 9.0 percent. The valuation resulted
in an impairment of $5 million being recognised.
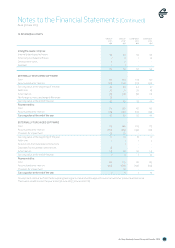
Other aircra values (excluding the Boeing 747-400 aircra) were tested for impairment using a value in use model. New Zealand generally
accepted accounting practice requires book values to be wrien down to the higher of fair value less costs to sell or value in use. The
indicative market valuations of aircra were less than the book value. In the opinion of the directors, the recoverable value from continued
use of the aircra as part of a network and their ultimate sale proceeds exceeded the book value of the aircra, based on the directors’
current assessment of the Group’s future trading prospects.
The aircra carrying values were tested for impairment based on a value in use discounted cash flow valuation. Cash flow projections were
prepared for 5 years using Board reviewed business plans. Key assumptions include exchange rates, jet fuel costs, passenger load factors
and route yields. These assumptions have been based on historical data and current market information. The cash flow projections are
particularly sensitive to fluctuations in fuel prices, exchange rates and economic demand and are extrapolated using an average growth
rate of approximately 2.0 percent (30 June 2012: 2.0 percent). The cash flow projections are discounted using rates of 8.0 and 10.0 percent
(30 June 2012: 8.0 and 10.0 percent). The valuations confirmed that there was no impairment to the aircra assets required.
Notes to the Financial Statements (Continued)
As at 30 June 2013